Services / S/01, FlagshipPowerVeritas Ltd

Performance Reviews.

A rigorous deep-dive into how your site is performing, why, and where the issues are, with optional ongoing monitoring against that baseline.

Initial deep-diveFlagship

Performance Reviews reconstruct the full production history of the site by turbine and time period. Losses are attributed across wind, availability, curtailment and underperformance, and flagged turbines are investigated for control, sensor or component issues. A prioritised recovery plan identifies the interventions with the largest energy impact.

Scope · Initial deep-dive
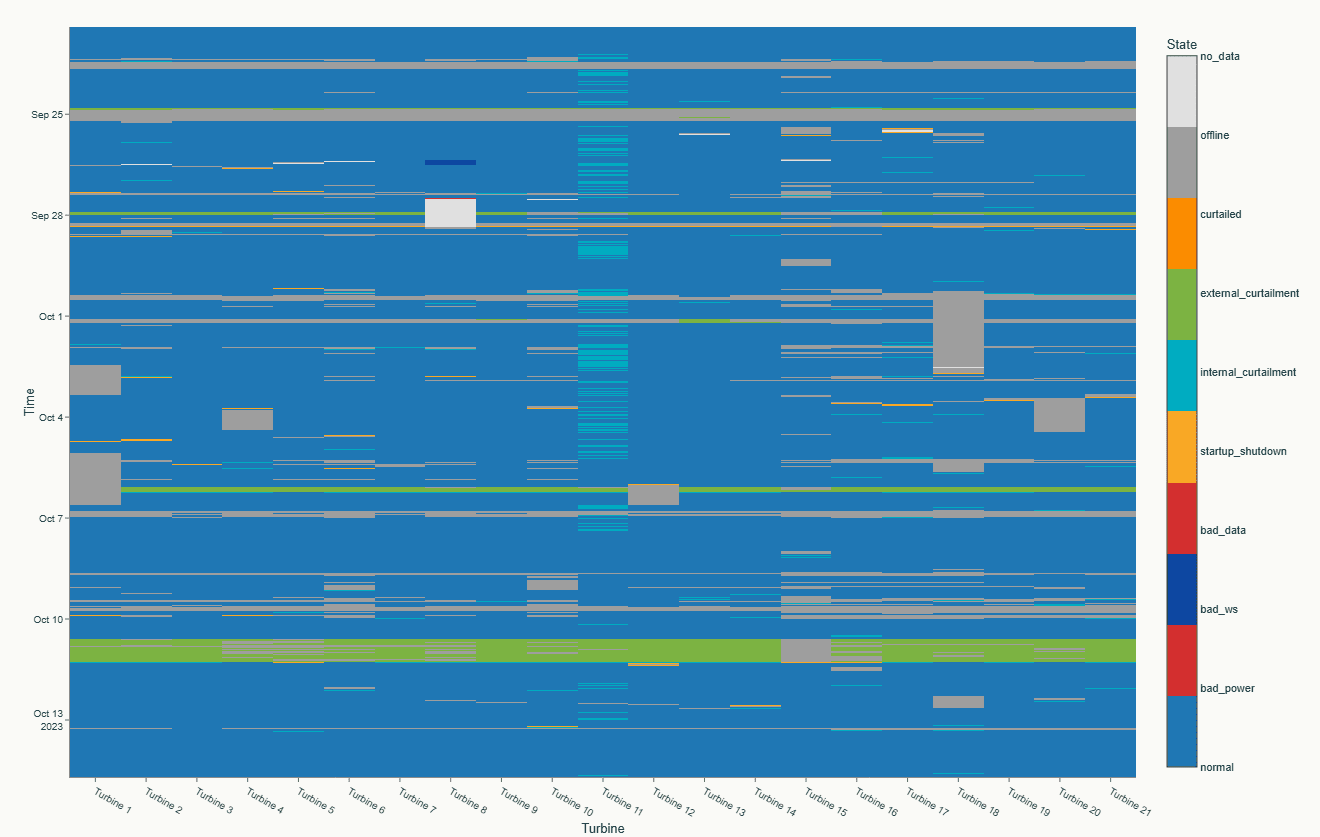
  • 01Production history & loss attributionWhy the site missed budget, broken down by cause.Site production is reconstructed from SCADA and losses quantified across wind, availability, curtailment and underperformance.
  • 02Data quality & reconciliationWhether the underlying data can be trusted.Completeness, consistency, reliability and cross-check of available SCADA data.
  • 03Power curve performanceWhich turbines are underperforming, by how much, and where in the wind range.Bin-level analysis corrected for density and turbulence, against site-specific and OEM reference curves.
  • 04Curtailment quantificationHow much production is being lost to curtailment, and to which cause.Grid, noise, shadow-flicker and wake-sector curtailment separated and quantified in MWh and revenue.
  • 05Engineering reviewWhat the data is telling you that headline KPIs miss.A Chartered Engineer reviews operational plots, cross-checks the data, and identifies control faults, sensor issues, and root causes hidden behind dashboard summaries.
  • 06Recovery planWhat to fix first, and what it is worth.Prioritised list of interventions, ranked by production impact and implementation effort.
Deliverable A

Executive waterfall report

Top-line losses attributed, ranked and quantified. Written for boards, owners and lenders.

Deliverable B

Turbine-level diagnostics pack

Per-turbine findings with supporting charts and data, for asset managers and operators to act on.

Deliverable C

Data export

Underlying turbine-level data and loss attribution outputs, delivered in Excel for integration with existing client reporting.


Optional
Monthly monitoring

Ongoing monthly monitoring add-on

A recurring service that tracks performance against the baseline, flags new issues, and updates the recovery plan monthly.

From data to diagnosis.

Most performance numbers fall apart under scrutiny because the underlying data has not been properly classified. The two illustrative outputs below are from a real review. SCADA is first classified into operating states so each 10-minute record is correctly categorised, allowing accurate loss quantification across curtailment, downtime, sensor faults and underperformance. A measured site curve is then produced from the clean data and compared against the contractual OEM curve.

Step 01 / Operating-state classification
Per-turbine state by 10-min interval
Heatmap of operating state by turbine and time. Most cells are blue (normal operation). Visible patterns: occasional grey bands (offline), turquoise vertical band on Turbine 11 (internal curtailment), and green horizontal stripes (external curtailment events affecting all turbines simultaneously).
Every 10-minute SCADA record is tagged: normal, curtailed (internal/external), startup/shutdown, offline, or bad data. Only normal points enter the power-curve fit. Patterns surface immediately. Here, Turbine 11 shows persistent internal curtailment and the site experiences periodic full-fleet external curtailment.
Step 02 / Measured vs OEM power curve
Single-turbine fit, classified scatter
Scatter plot of wind speed against power output for a single turbine. Most points form a tight band around the OEM curve. Off-curve points are colour-coded: external curtailment (low-power points), internal curtailment (capped points below rated), startup or shutdown, and flagged bad data. The measured binned curve runs slightly above the OEM curve at low wind speeds and converges at rated.
With states classified, a binned measured curve is fit to normal-operation points only. Off-curve scatter is preserved and colour-coded so curtailment, sensor faults and startup/shutdown losses are visible (and quantified separately in the loss waterfall) rather than silently distorting the fit.

Common questions.

What does a wind farm performance review cover?

A performance review reconstructs the full production history of the site by turbine and time period from SCADA data. Energy losses are then quantified by cause across wind resource deviation, availability, curtailment, and turbine underperformance. Power curves are analysed for control faults, sensor drift, and component issues. The output is a prioritised recovery plan ranking interventions by energy impact and implementation effort. Reviews are available as a one-off or with ongoing monthly monitoring against the established baseline.

What SCADA data is needed for a performance review?

The minimum dataset is 10-minute SCADA at turbine level. Required signals include timestamp, active power, wind speed, pitch angle, rotor speed, ambient temperature, and operating state. Site-level revenue meter data improves reconciliation accuracy. Additional signals such as wind direction and yaw position, wind speed standard deviation, curtailment setpoints, alarm and event logs, and electrical parameters enable enhanced attribution including yaw misalignment analysis, turbulence stratification, and electrical constraint quantification. Engagement is possible with reduced datasets. The analysis adapts and clearly notes the limitations.

Want to review a site or portfolio?