Why state of charge is so hard to estimate in a BESS
State of charge is one of the most important numbers for a battery asset, and one of the hardest to measure accurately.
One of the main challenges in measuring state of charge (SOC) accurately is how flat the open circuit voltage (OCV) curve is across the normal operating range.
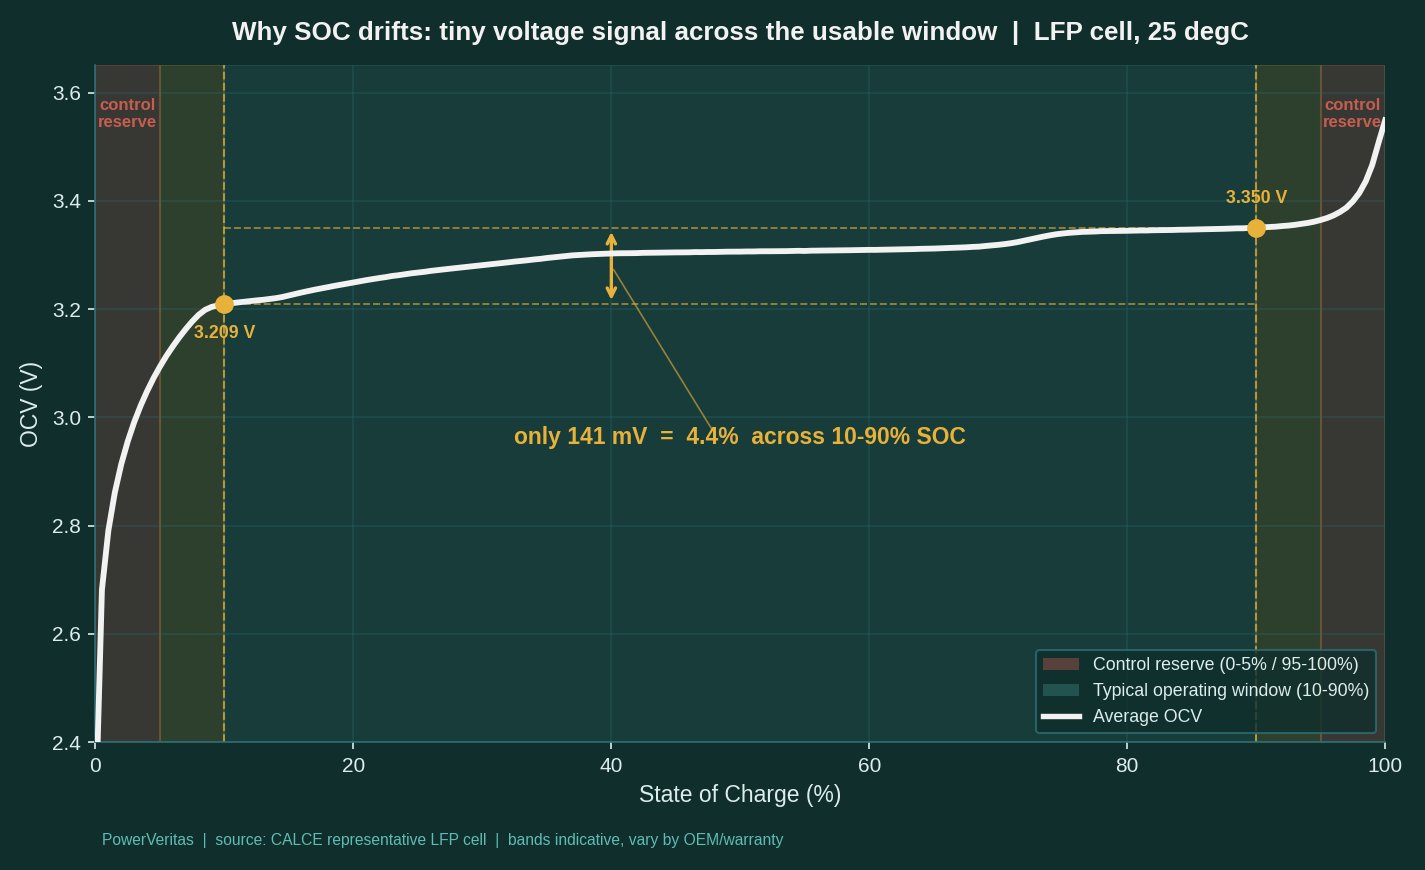
This plot, from measured data for a representative lithium iron phosphate (LFP) cell, shows that across the normal operating window of 10% to 90% SOC, the cell voltage changes by only 4.4%.
Combine that small signal with voltage measurement error, temperature shifts, and different curves for charge and discharge, and direct voltage-based SOC becomes unreliable.
Instead, SOC estimates are based on integrating current from a known point, known as Coulomb counting. The estimate is then re-calibrated at high and low SOC, where the OCV curve is steep and the reading is more accurate.
For owners, undetected SOC drift means trading decisions are built on a number that is quietly wrong.
Charts and analysis by PowerVeritas. Where open datasets are used, sources are credited on the attributions page.