Services / S/03PowerVeritas Ltd

Additional Services

Focused technical work for wind farm owners, operators and investors who need a specific engineering question answered.

Targeted engineering, scoped to the question

Every service is independent of OEM and O&M. Findings are specific, evidenced, and written to stand up in contract, warranty and commercial discussions.

  • A/01Curtailment & loss quantificationSeparating and quantifying grid, noise, shadow-flicker, bat and sector curtailment. Outputs in MWh and revenue.
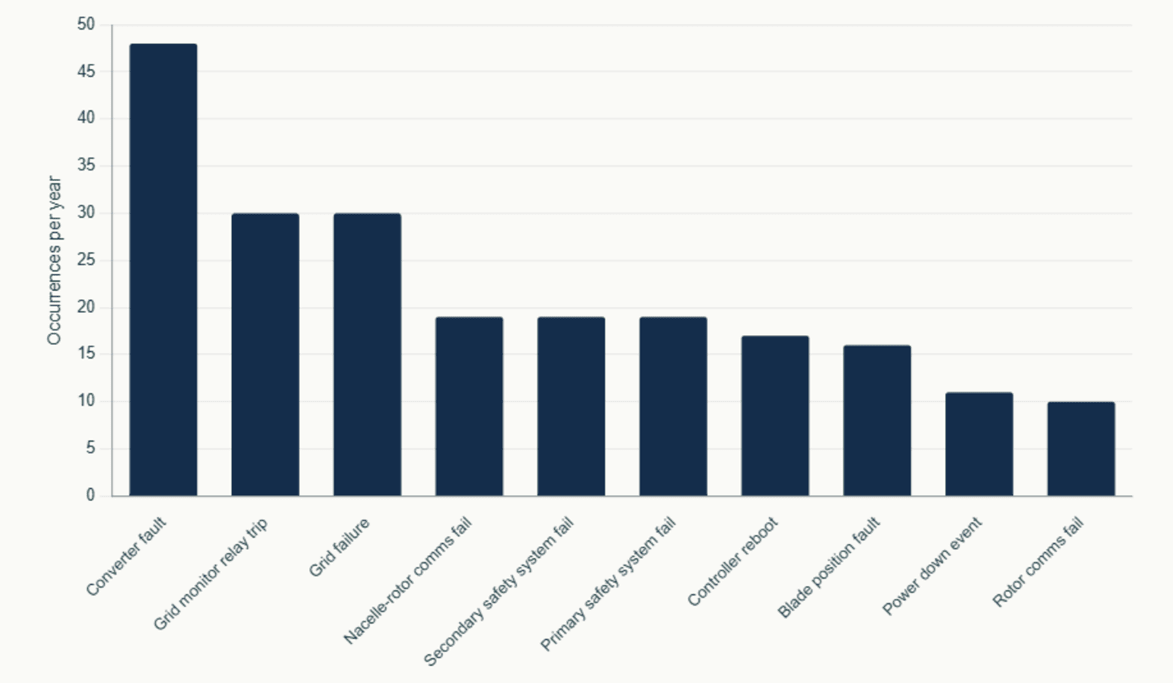
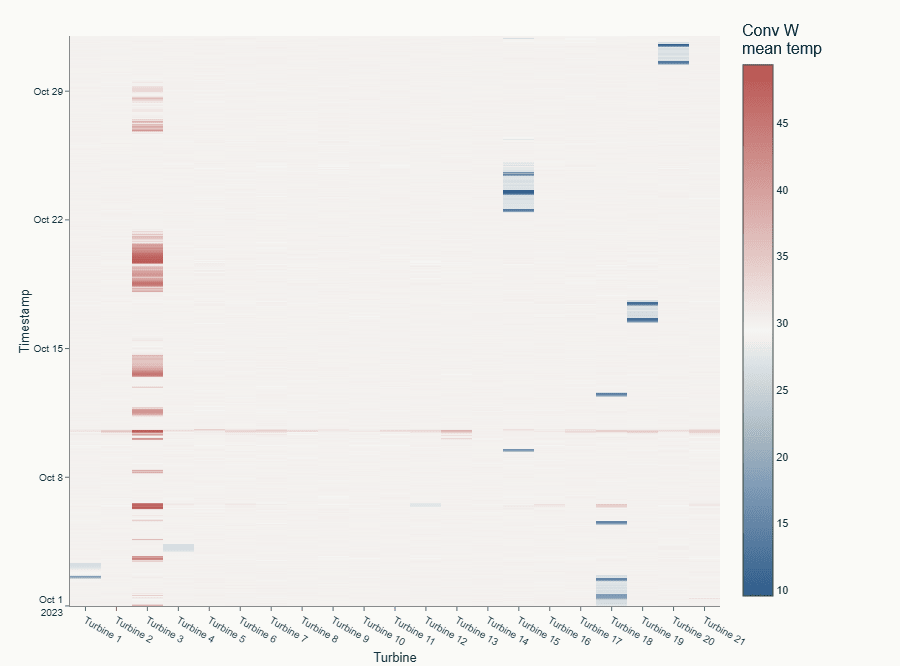
  • A/02O&M performance & reliability analysisIndependent analysis of site downtime by cause and duration, with KPI calculation. Fault code and failure rate diagnostics with improvement actions.
  • A/03Commissioning & warranty checkIndependent review of commissioning data and warranty-period performance, with defensible findings for claims.
  • A/04Upgrade performance verificationBefore/after quantification of OEM upgrade packages, power-curve kits and control-system interventions.
  • A/05Budget production re-forecastingP50/P90 production re-forecast using operating history, with expected losses broken down by cause.
  • A/06RCA investigation supportEngineering analytics supporting root cause analysis investigations into component failures, serial defects and anomalous events.
  • A/07Life extension strategy supportSupport for owners weighing life extension, repowering, or decommissioning. Covers strategy options, technical scoping, review of aeroelastic and third-party studies, risk assessment and summary reporting.
  • A/08Annual O&M claim verificationIndependent verification of the contractor's annual availability claim, exclusions and liquidated damages calculation, against contractual definitions and SCADA evidence. Delivered to the contractual dispute window, suitable for contractor correspondence and lender reporting.
From A/02
Top 10 alarm types by annual frequency
Fig. A/02
Bar chart of the ten most frequent alarm codes across a wind farm fleet, normalised to occurrences per turbine per year. Converter fault leads at around 48, followed by grid monitor relay trip and grid failure at around 30 each, then nacelle-rotor comms fail, secondary and primary safety system fail at 19, and a tail of controller reboot, blade position fault, power down event and rotor comms fail.
Site downtime is rarely one big problem; it's a frequency distribution. Ranking alarm codes by occurrences per turbine per year separates the headline drivers (here, converter and grid-side faults) from background noise, and exposes which alarms are penalising on the contract versus which are excluded. A chart like this lets owners and O&M prioritise the highest-value opportunities and start the reliability conversation from evidence.
From A/06
Converter winding temperature heatmap
Fig. A/06
Heatmap of converter winding mean temperature for 21 turbines across roughly five weeks. Most cells are pale, indicating typical operating temperatures. Turbine 3 shows persistent deep-red bands, running consistently hotter than the rest of the site. A faint horizontal red band crosses all turbines on a single hot ambient day. Cold blue bars on Turbines 13, 14, 17 and 19 mark offline periods where equipment cooled to ambient.
Component-level signals show up clearly when 10-minute SCADA is laid out turbine-by-time. Turbine 3 is running materially hotter than the rest of the site on the same ambient and load conditions. The cause is not assumed from the chart, but the pattern is enough to warrant targeted investigation. Evidence of this kind underpins commissioning and warranty correspondence and RCA investigations.

What you receive

Deliverable A

Engineering report

Written report setting out scope, methodology, findings, and conclusions, with supporting charts and analysis. Length and format are matched to the question, ranging from short technical memos to longer advisory reports for strategic engagements. Suitable for board, lender, owner, or O&M discussion as appropriate.

Deliverable B

Analysis pack

Underlying analytical outputs and supporting evidence from the engagement, delivered in Excel or equivalent format for integration with the client's own analysis.

Bespoke engagements

For work that does not fit a standard service line, including portfolio-level advisory, expert support for disputes or insurance matters, and longer-form strategic engagements, scope and pricing are agreed case by case.

Common questions

What does an annual O&M claim verification involve?

Annual O&M claim verification is an independent check of the contractor's year-end availability claim, performed against the contractual definitions of availability, exclusions and liquidated damages. The work covers reconciliation of contractor-reported downtime against SCADA evidence, review of exclusion categories applied (force majeure, grid, weather, scheduled service), and recalculation of the resulting LD position. Delivered to the contractual dispute window so findings can be used in contractor correspondence, internal sign-off, or lender reporting. Most commonly engaged on a recurring annual cycle.

What does life extension support involve?

Life extension support is advisory work for owners weighing whether to extend a site's operational life beyond original design, repower with new turbines, or decommission. Typical activities include strategy options appraisal, scoping of required technical studies, review of aeroelastic modelling and third-party engineering reports, risk assessment, and summary reporting to inform the owner's decision.

What if my problem doesn't fit one of the listed services?

Many engagements start as a question that doesn't fit a standard service line. Examples include expert support for warranty disputes, technical input to insurance discussions, and bespoke analytics on specific operational issues. These are scoped and priced case by case. The starting point is a short call to understand the question, the data available, and the commercial context. From there, a custom proposal follows.

Want to review a site or portfolio?