Diagnosing a faulty anemometer
How a simple sensor cross-check, a distribution comparison and a site-wide ratio map together separate a single faulty anemometer from genuine turbine underperformance.
Before launching a deep underperformance investigation, it is worth asking a simpler question first. Is the turbine underperforming, or is a sensor faulty? This is a worked example showing how three quick checks isolate the answer on one turbine.
Step 1, the screen
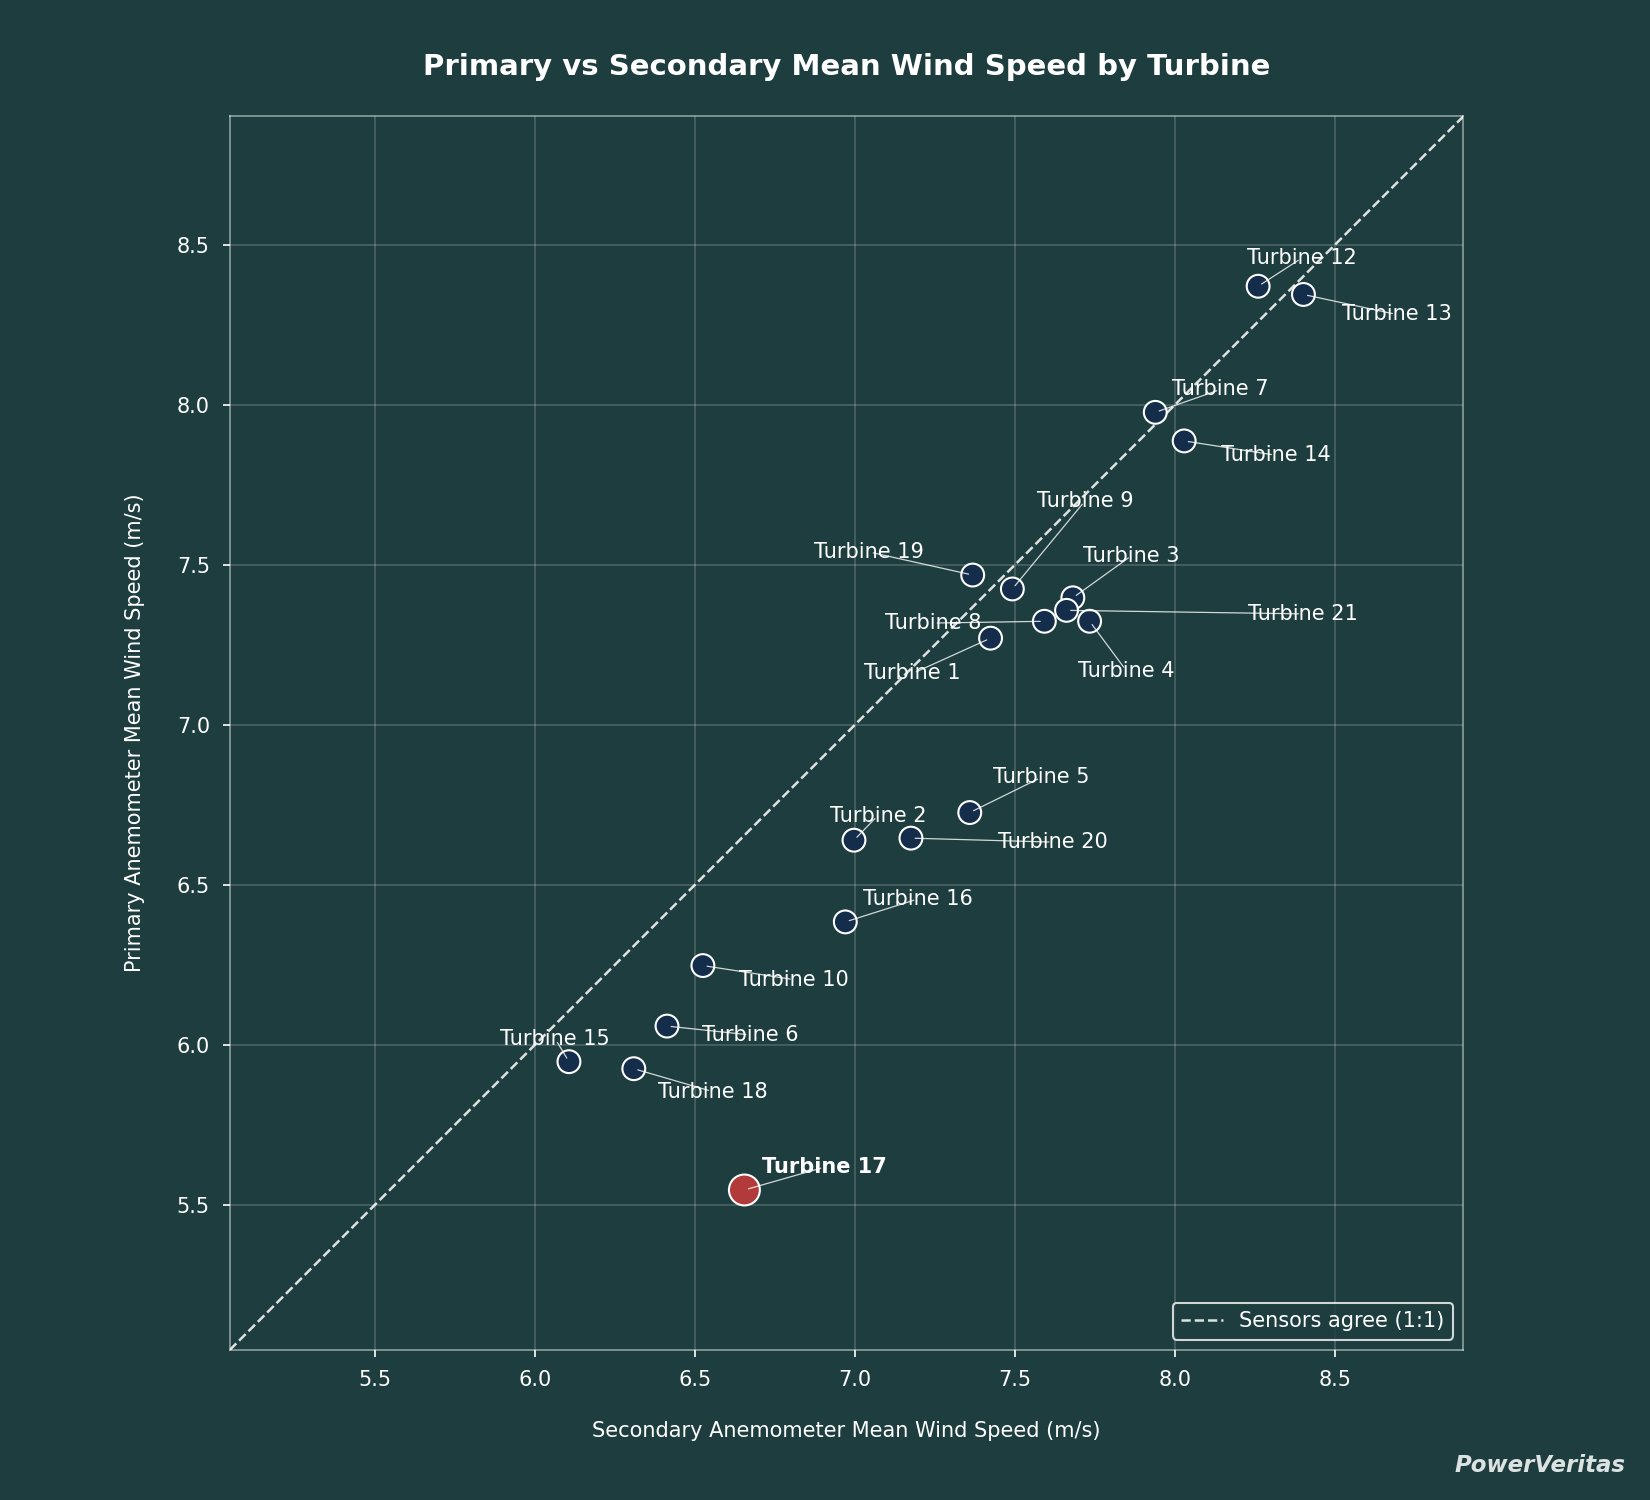
Compare mean wind speed from the primary and secondary anemometers for each turbine. Both sensors sit on the same nacelle, so over a reasonable period they should agree closely. Any turbine well off the 1:1 line is almost certainly a sensor issue, not a performance issue.
Turbine 17 stands out. Its primary reads about 1 m/s lower than its secondary, too large to be the normal difference between a cup and a sonic sensor. That flags the sensor for a closer look before any power curve conclusion is drawn.
Step 2, confirm which sensor
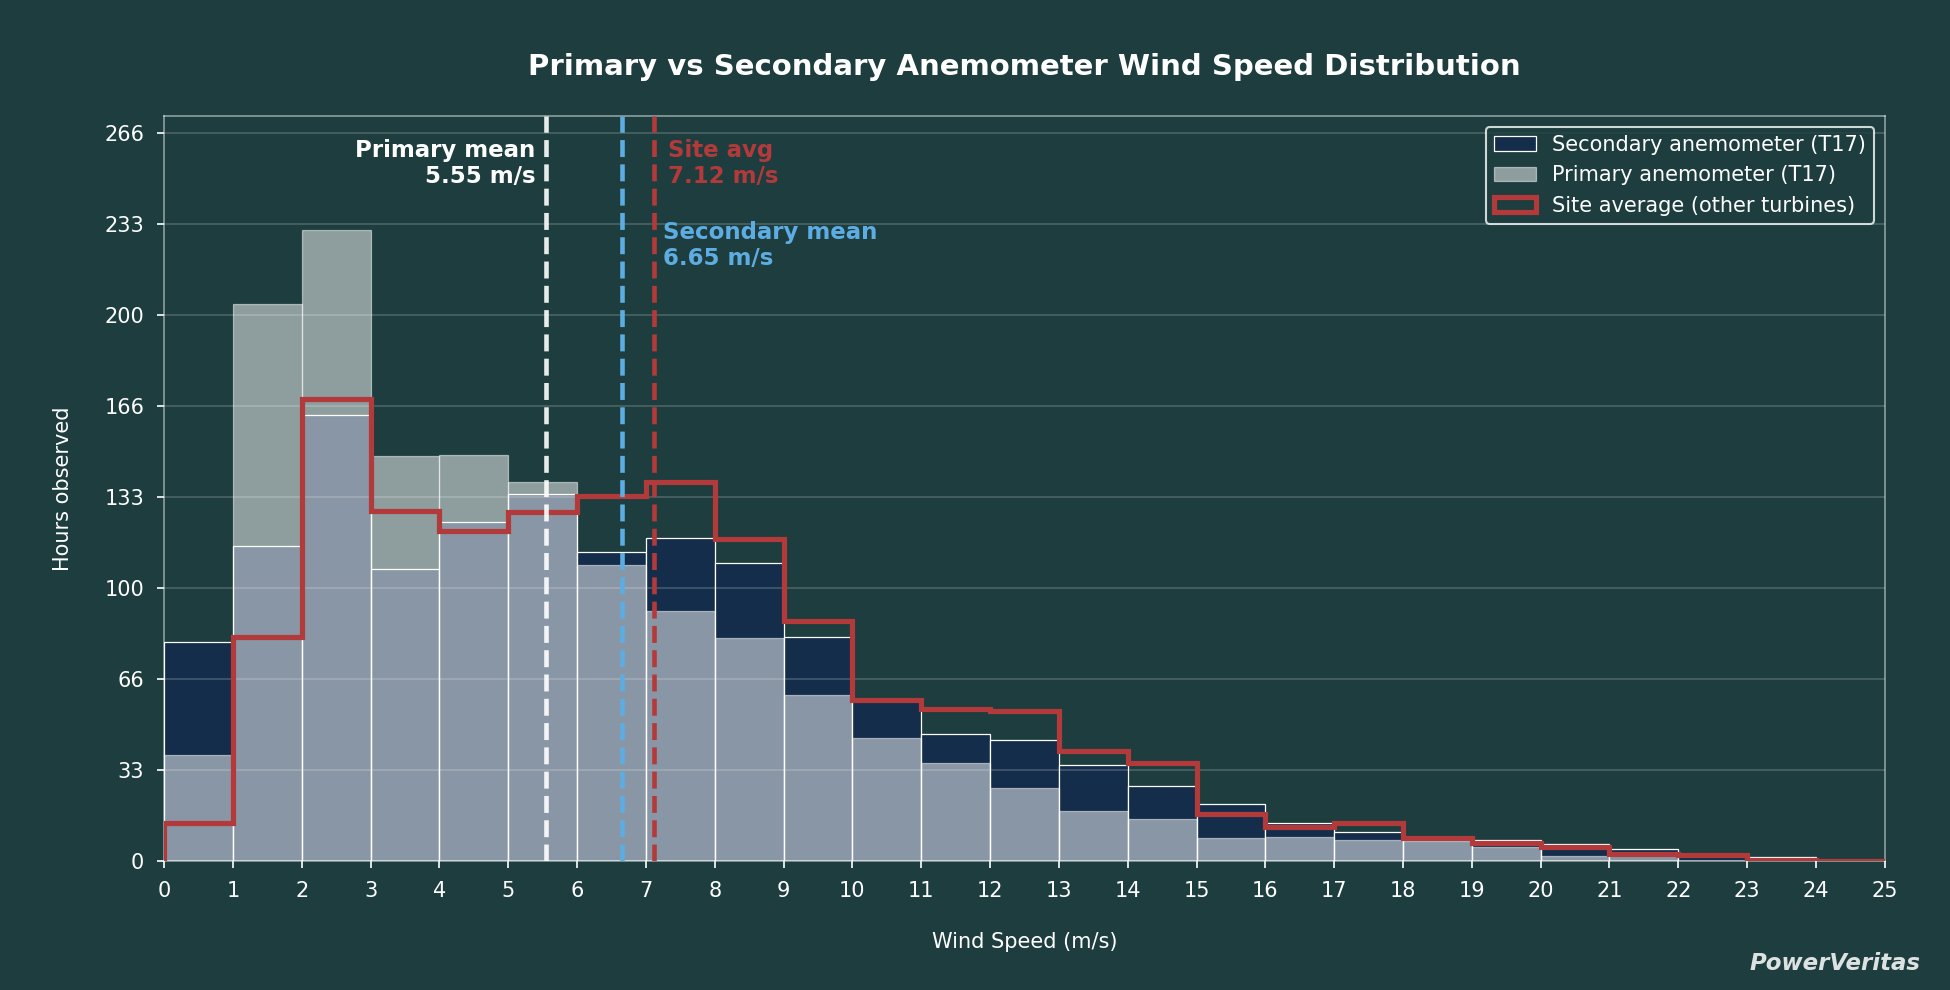
The screen flags Turbine 17, but not which of its two sensors is wrong. The wind speed distribution settles it. The primary has a mean of 5.55 m/s, well below both its own secondary at 6.65 m/s and the site average of the other turbines at 7.12 m/s. A genuinely low-wind turbine would read low on both sensors and against the fleet. Here only the primary is the outlier, so the primary is the faulty sensor.
Two things could explain the drift:
- This turbine model often pairs a sonic primary with a cup secondary. One sensor type's calibration may have drifted more than the other.
- The two sensors sit on opposite sides of the nacelle, so flow distortion around the nacelle can affect them differently.
Step 3, rule out terrain
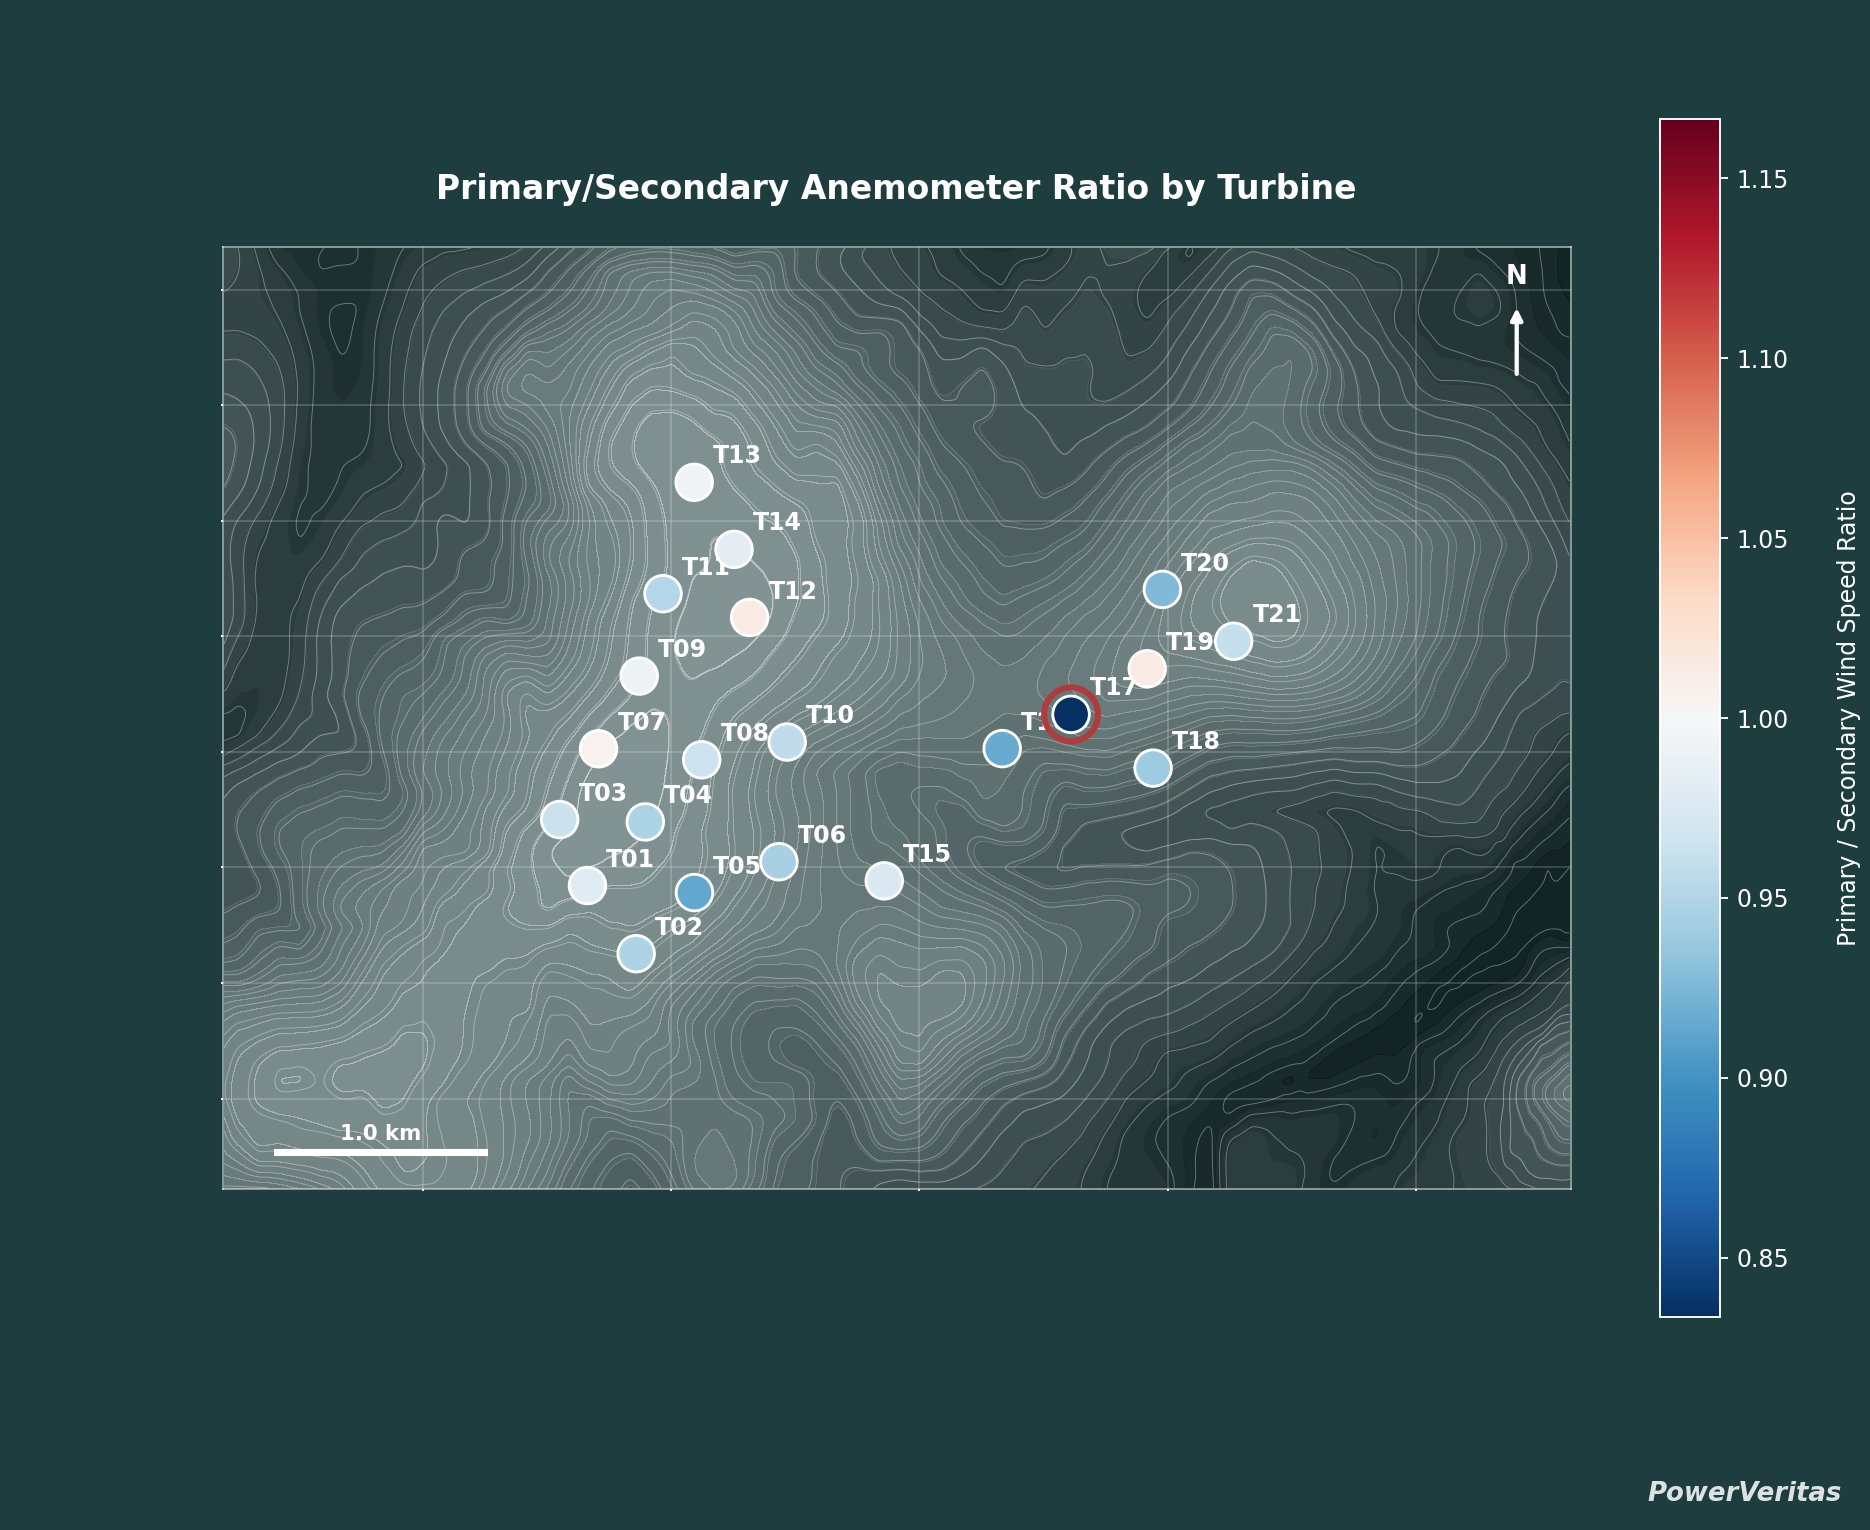
One explanation remains. Could terrain cause the offset? The turbine does sit on top of a ridge. Mapping the ratio of primary to secondary reading across the whole site tests this. There is no clear spatial pattern, and Turbine 17 is the clear low outlier. The offset from the other turbines on the same ridge is far too large to be terrain alone.
The map also shows a slight systematic difference between primary and secondary across the whole fleet. That is worth its own investigation into the calibrations and transfer functions used by the turbines and sensors.
In short
Three quick checks, one clear conclusion. Use the secondary for the affected turbine and treat the primary as suspect until inspected. Sensor health first, performance analysis second.
Charts and analysis by PowerVeritas. Where open datasets are used, sources are credited on the attributions page.