
A faulty anemometer is not just bad data
A nacelle anemometer does more than record the wind, it decides when the turbine stops. When one primary sensor started over reading, the turbine shut itself down 53 times in eleven days and lost roughly 50 MWh.
A nacelle anemometer is usually treated as a measurement device. It is also a control input. The turbine uses it to decide when the wind is too strong to keep running.
In March 2025 the primary anemometer on one turbine started over reading. Over the following eleven days the turbine stopped itself 53 times under a high wind alarm. Its secondary anemometer never averaged more than 19 m/s over any 10 minute period in those eleven days. Nothing else was wrong with the turbine.
The sensor did not fail quietly, it failed high
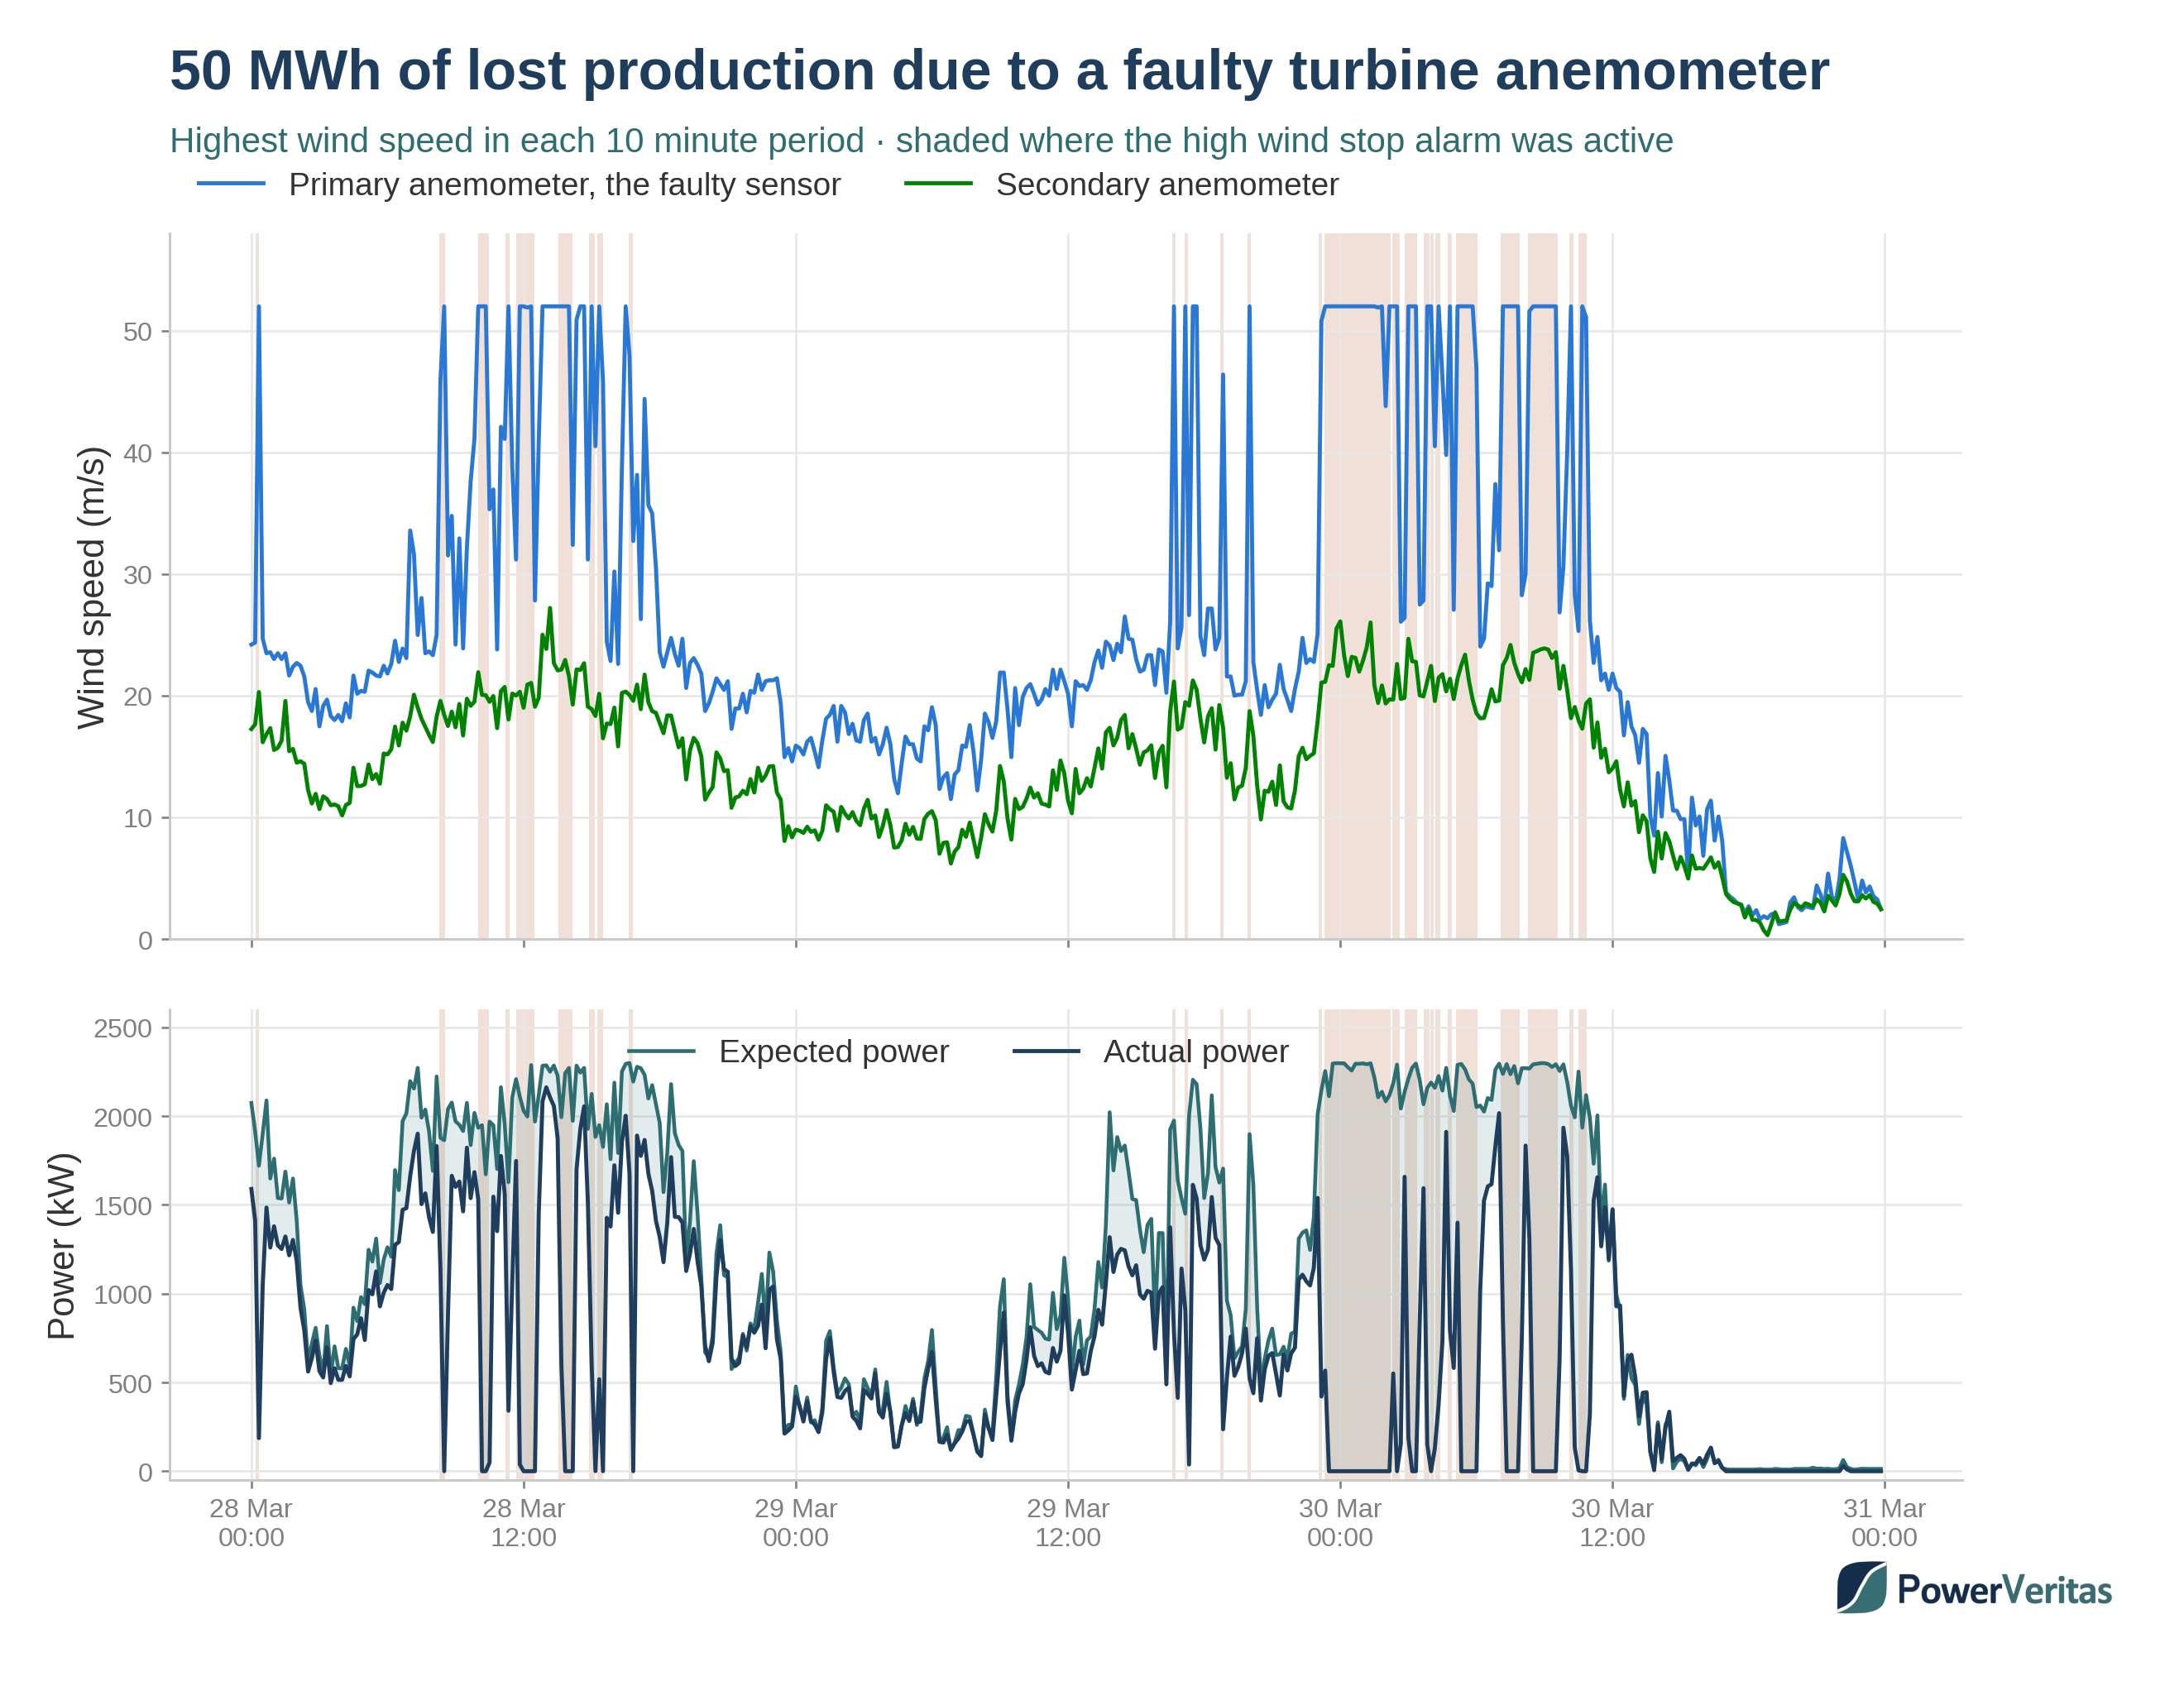
A dead sensor is easy to spot, a sensor that reads too high looks like weather.
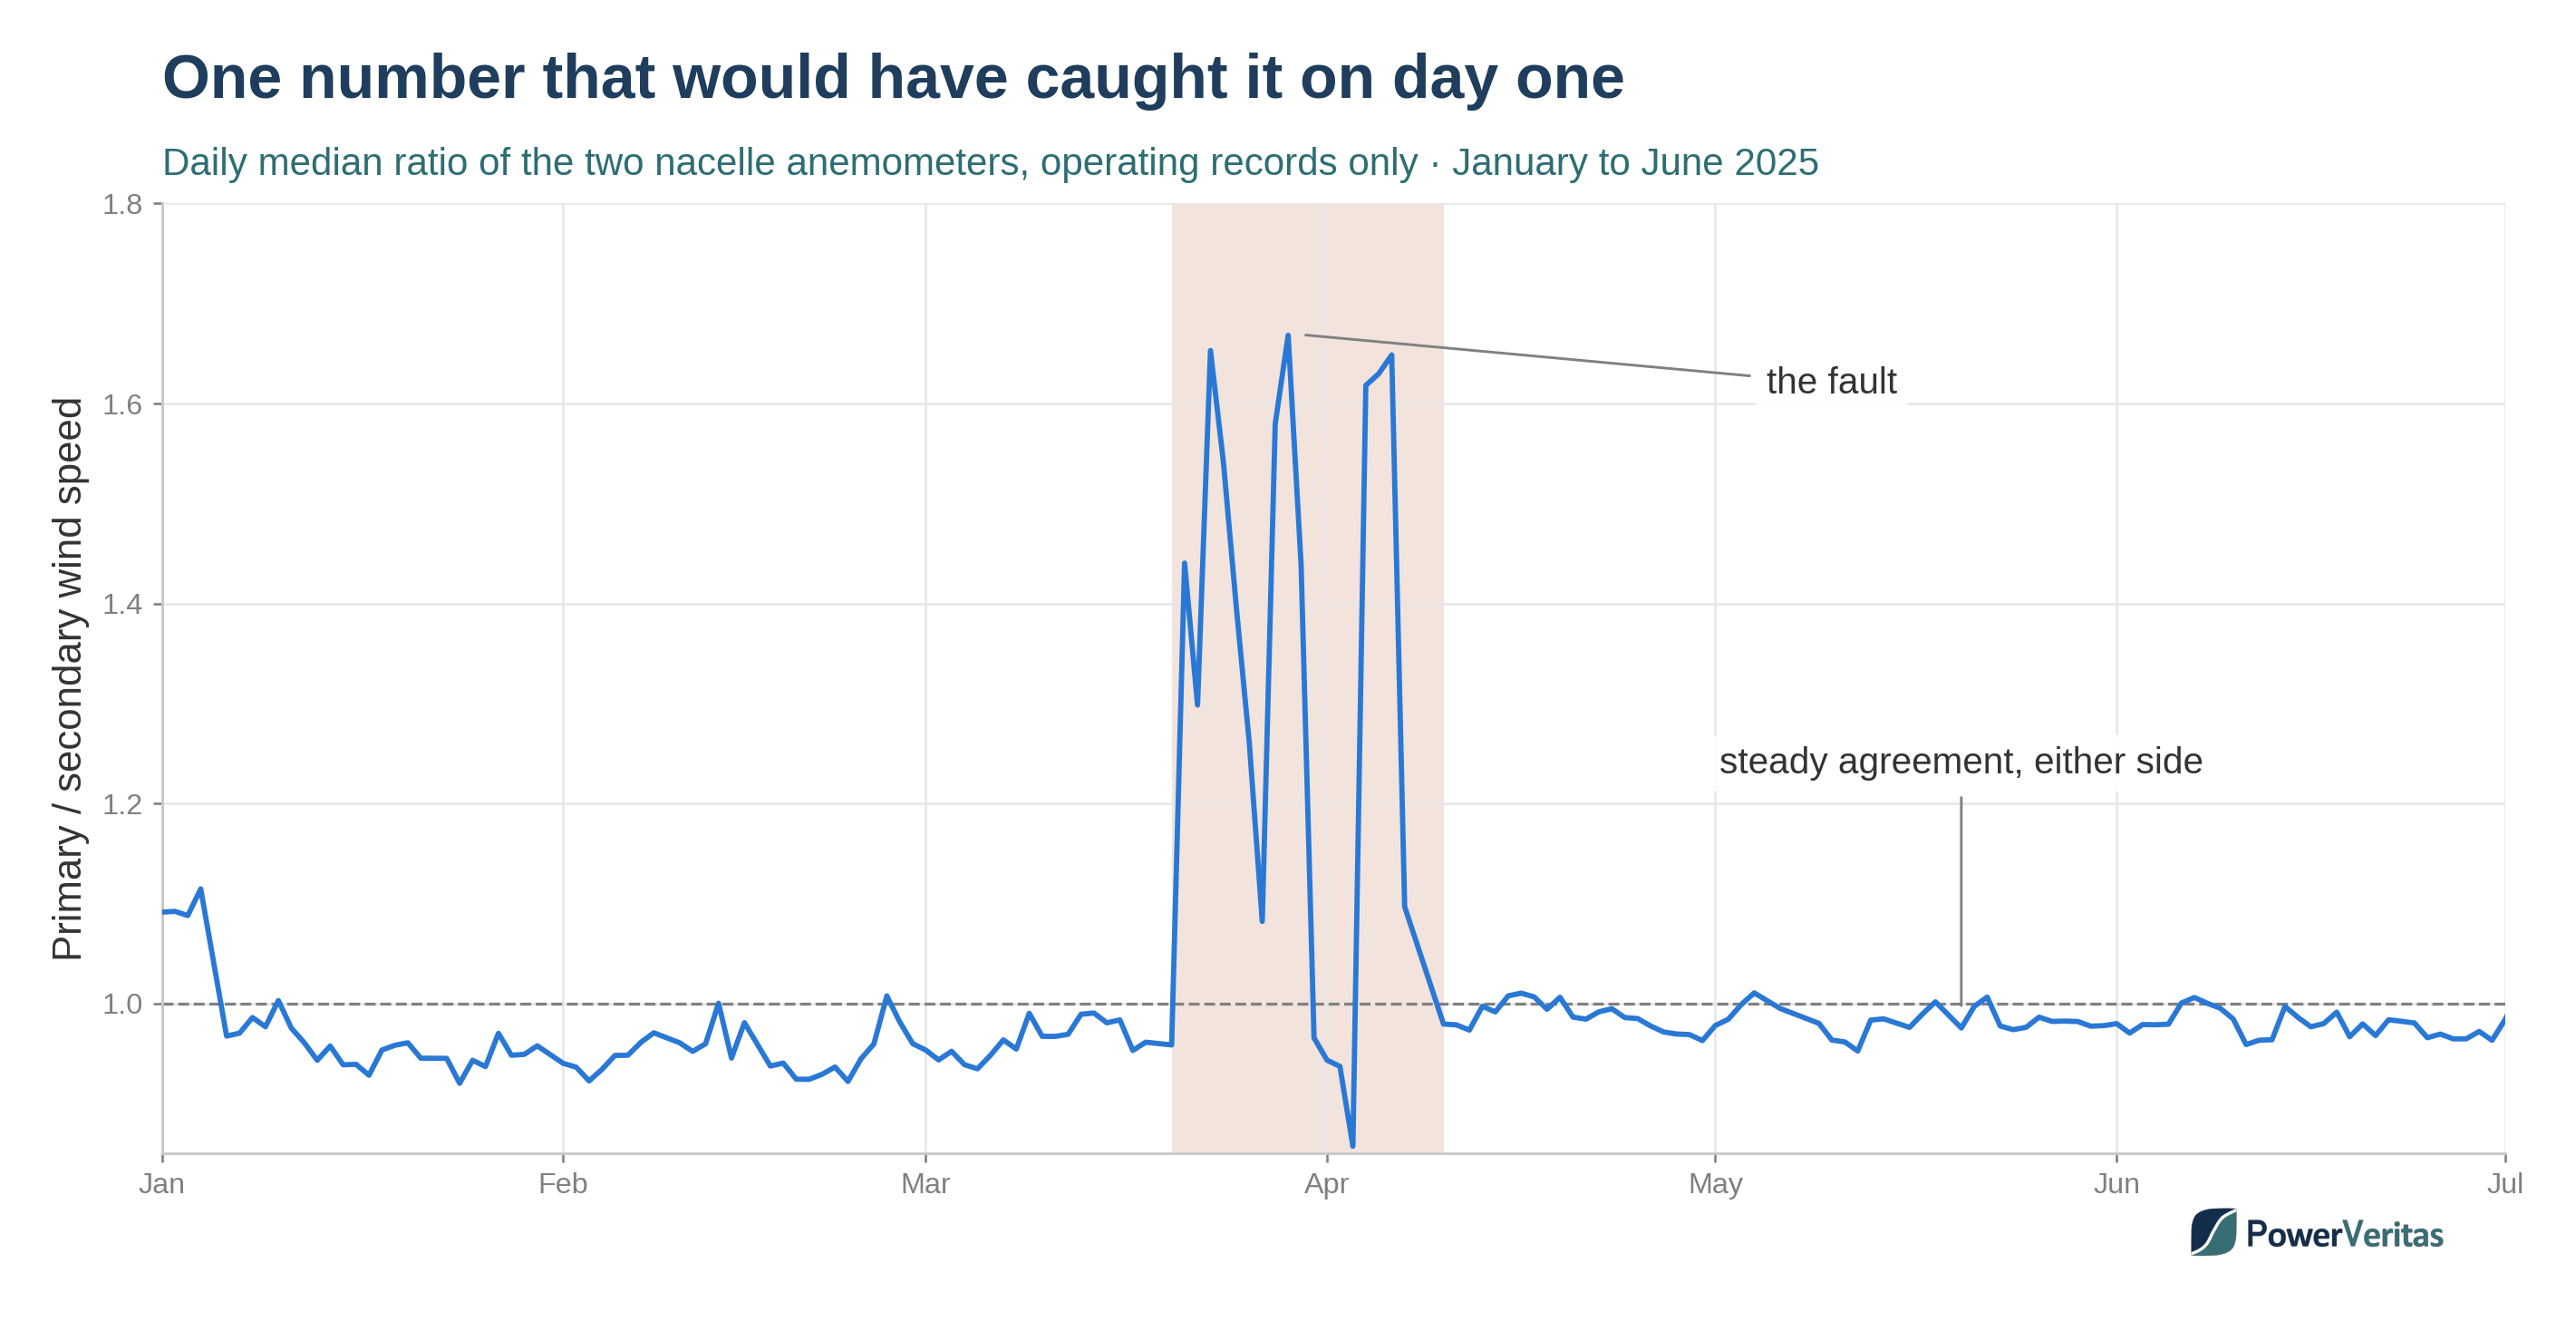
Across the eleven days the primary reached 52 m/s within a 10 minute period and sat at or above 50 m/s in 190 of the 1584 periods. The secondary peaked at 27.2 m/s over the same eleven days. The daily ratio between the two sensors had been steady near 0.95 for months. It moved to 1.44 on the first day of the fault and reached 1.67.
High wind protection is not a single threshold. A turbine normally carries several, a high wind speed over a short average and progressively lower ones over longer averages, so that a gust front and a sustained blow are both caught. A sensor reading high trips the short average thresholds first, and this one did, 53 times, for 24 hours of alarm time across the eleven days.
Most of the loss happened while the turbine was stopped
Comparing what the turbine produced against what the same wind should have produced puts the eleven day loss at roughly 50 MWh, or 29% of expected production for the period.
About 35 MWh of that is downtime from the 53 false shutdowns. About 8 MWh went in premature High Wind Ride Through, where the turbine trims its own output as the reported wind rises so that it can keep running through a storm instead of stopping outright. It derated early because it believed the wind was stronger than it was. The rest went in ramping back up after each stop.
The premature High Wind Ride Through term is the one that would be missed. It is not downtime, the turbine was running and available throughout, so a production based availability calculation counts those hours as delivered.
The shutdowns sit in the wrong contractual category
A high wind stop is normally categorised as non penalising and excluded from contractual availability, on the grounds that the wind is outside the contractor’s control.
Here the wind was not the cause, the sensor was. The same downtime can therefore be challenged and recategorised as penalising, so that it counts against the availability guarantee rather than being written off as weather. Confirming that each excluded event is genuinely non penalising is the work of an annual O&M claim verification.
What the data shows
- The faulty primary read high, not low, which is why the fault presented as storm shutdowns rather than as apparent underperformance.
- Roughly 50 MWh was lost in eleven days, about 35 MWh in downtime, 8 MWh in premature High Wind Ride Through and the rest in ramping back up.
- The daily ratio between the two nacelle anemometers moved outside its normal range on the first day of the fault, nine days before the last shutdown.
- The fault was rectified on 10 April, after which the ratio settled at 0.98 and the shutdowns stopped.
The same records look very different against each sensor
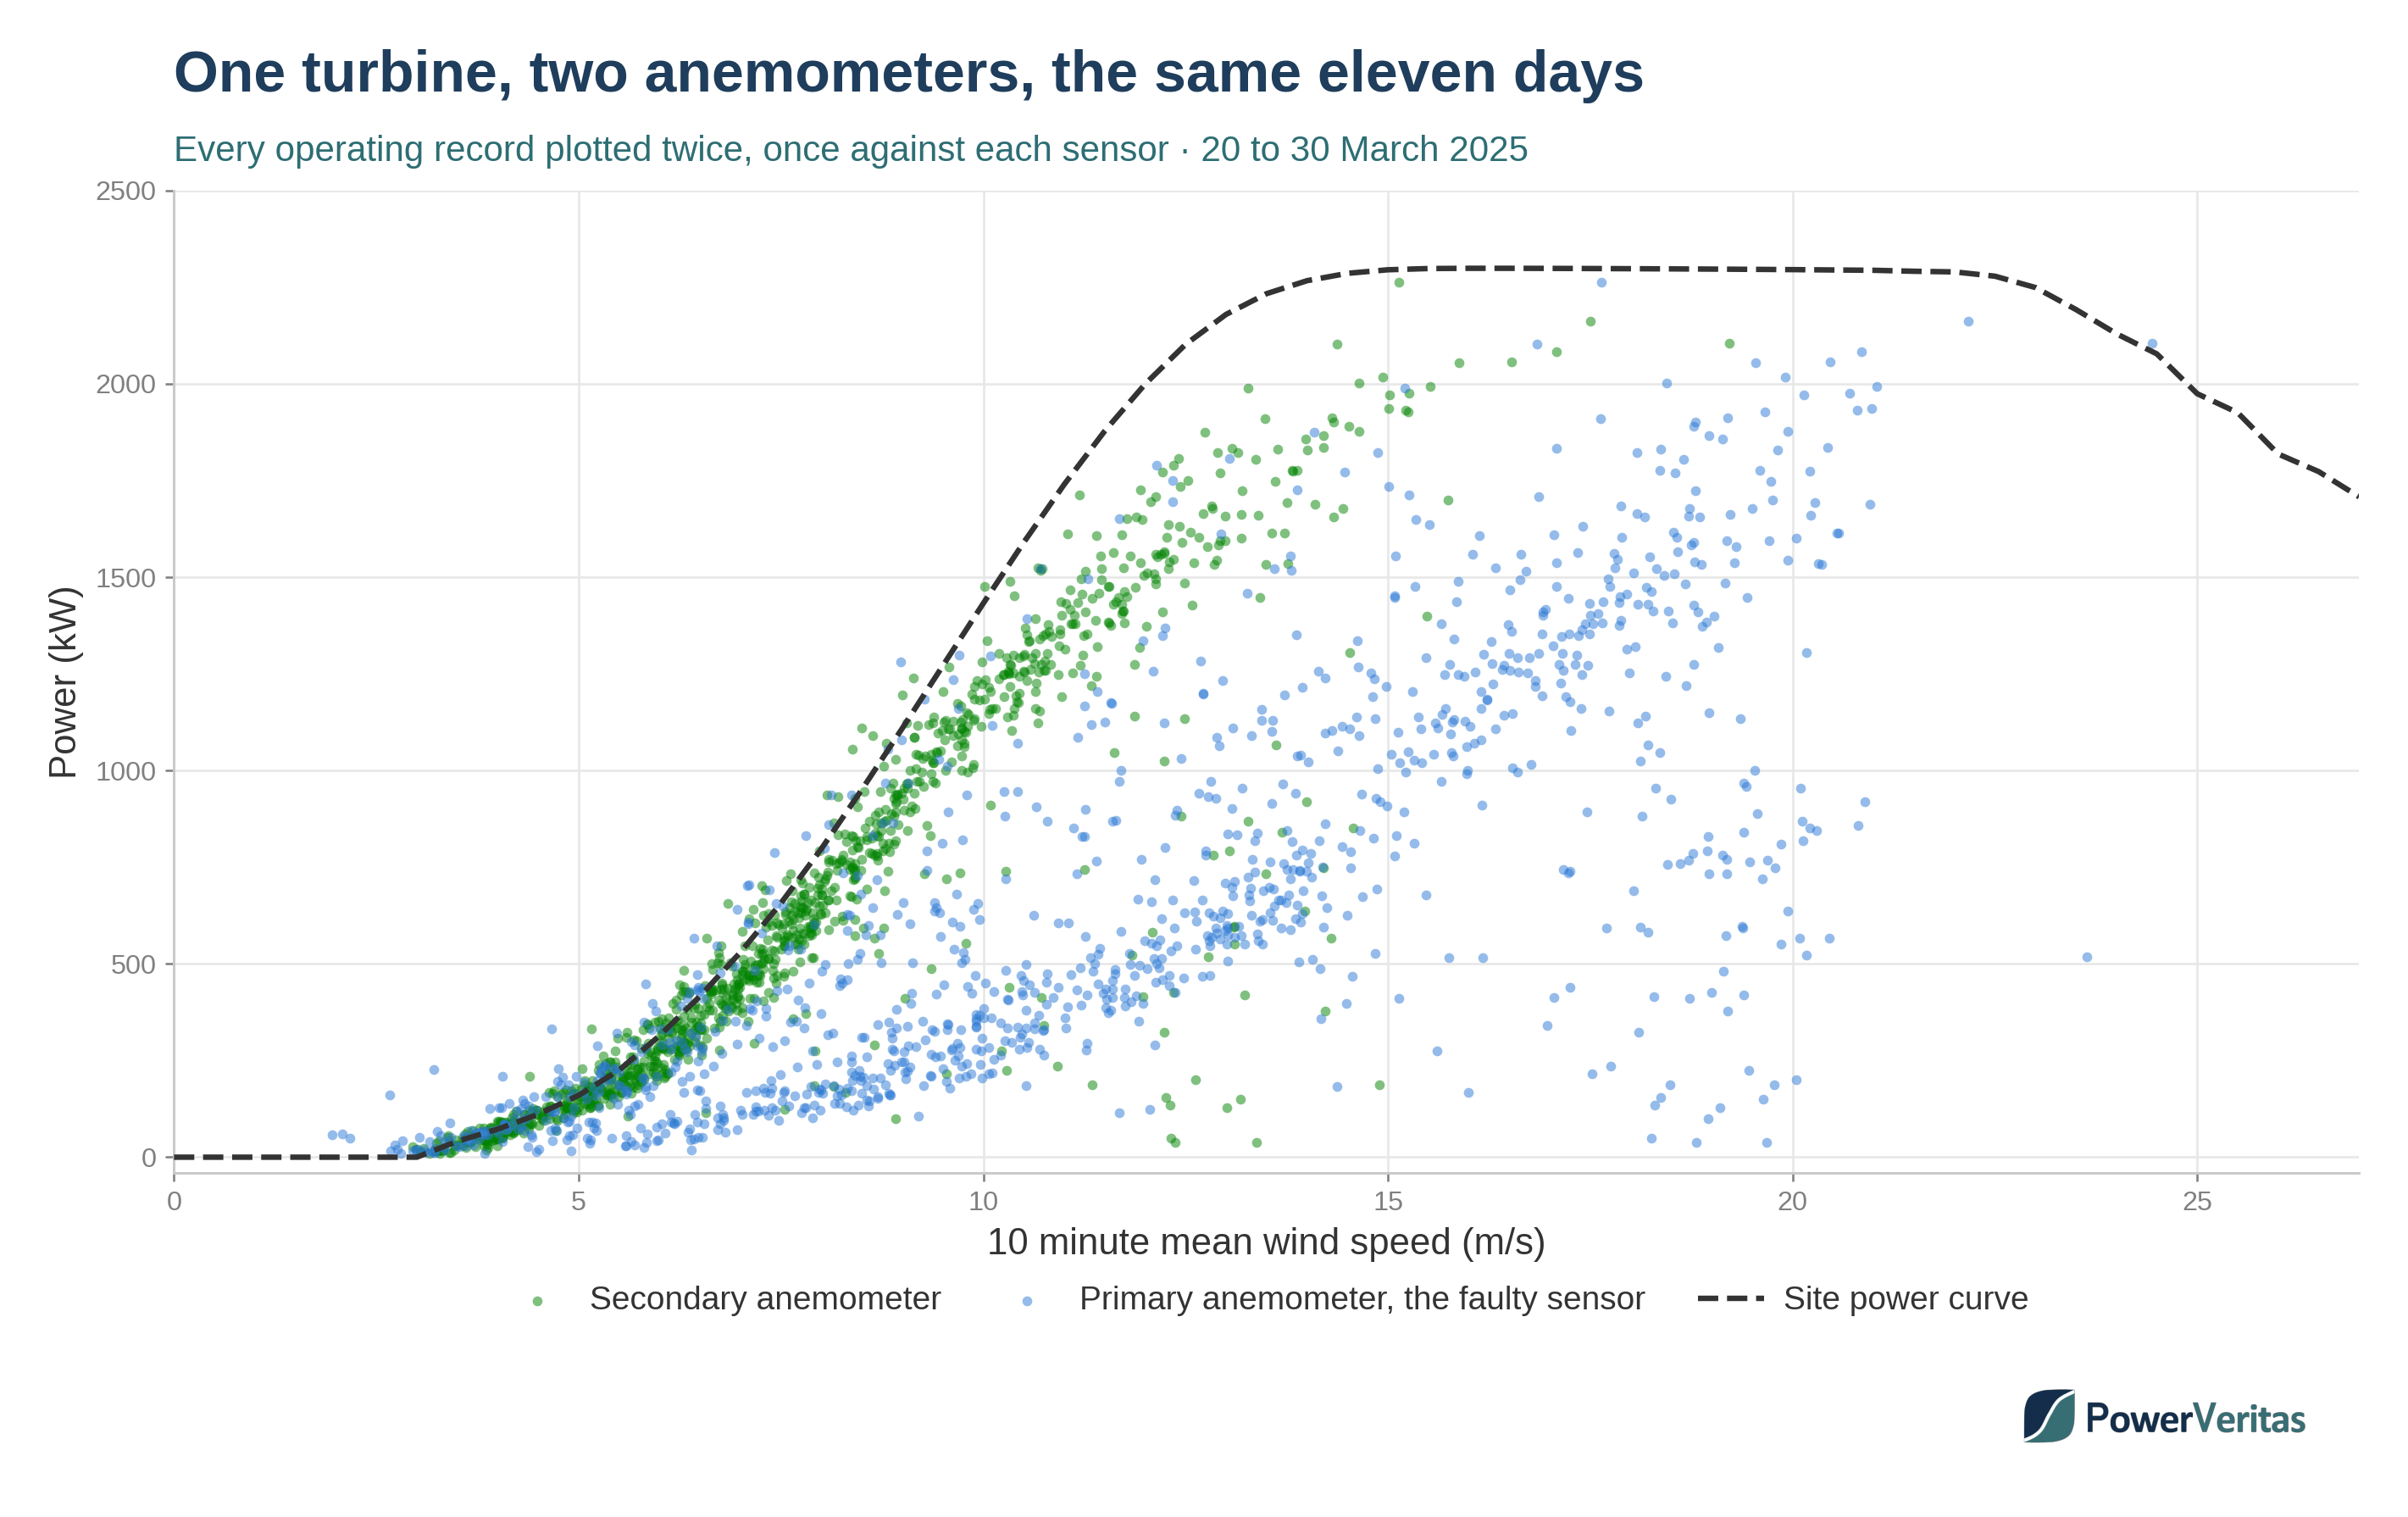
Plotting the identical power records against each anemometer in turn shows the fault directly.
Against the secondary the points sit much closer to the site power curve, though still to the right of it by roughly 1 m/s. The secondary is not a calibrated reference, it reads about 5% higher than the primary did before the fault. Against the faulty primary the same points sit roughly 3 m/s to the right and are heavily scattered. The power curve shows the fault very clearly.
Anemometer health is worth checking before it becomes a performance question. Comparing the two sensors on each nacelle as a ratio, rather than as two separate trends, is what makes a fault like this obvious. Doing the same across a fleet is what separates one faulty sensor from genuine underperformance, which is the subject of an earlier worked example, diagnosing a faulty anemometer.
PowerVeritas checks sensor health alongside curtailment, downtime and derating when quantifying the real causes of lost production from operational SCADA data, as part of its Performance Reviews.
Charts and analysis by PowerVeritas. Where open datasets are used, sources are credited on the attributions page.