UK onshore wind is getting more productive, curtailment is hiding it
Headline capacity factors have barely moved since 2004. Add back curtailed energy and the real trend points clearly upward.
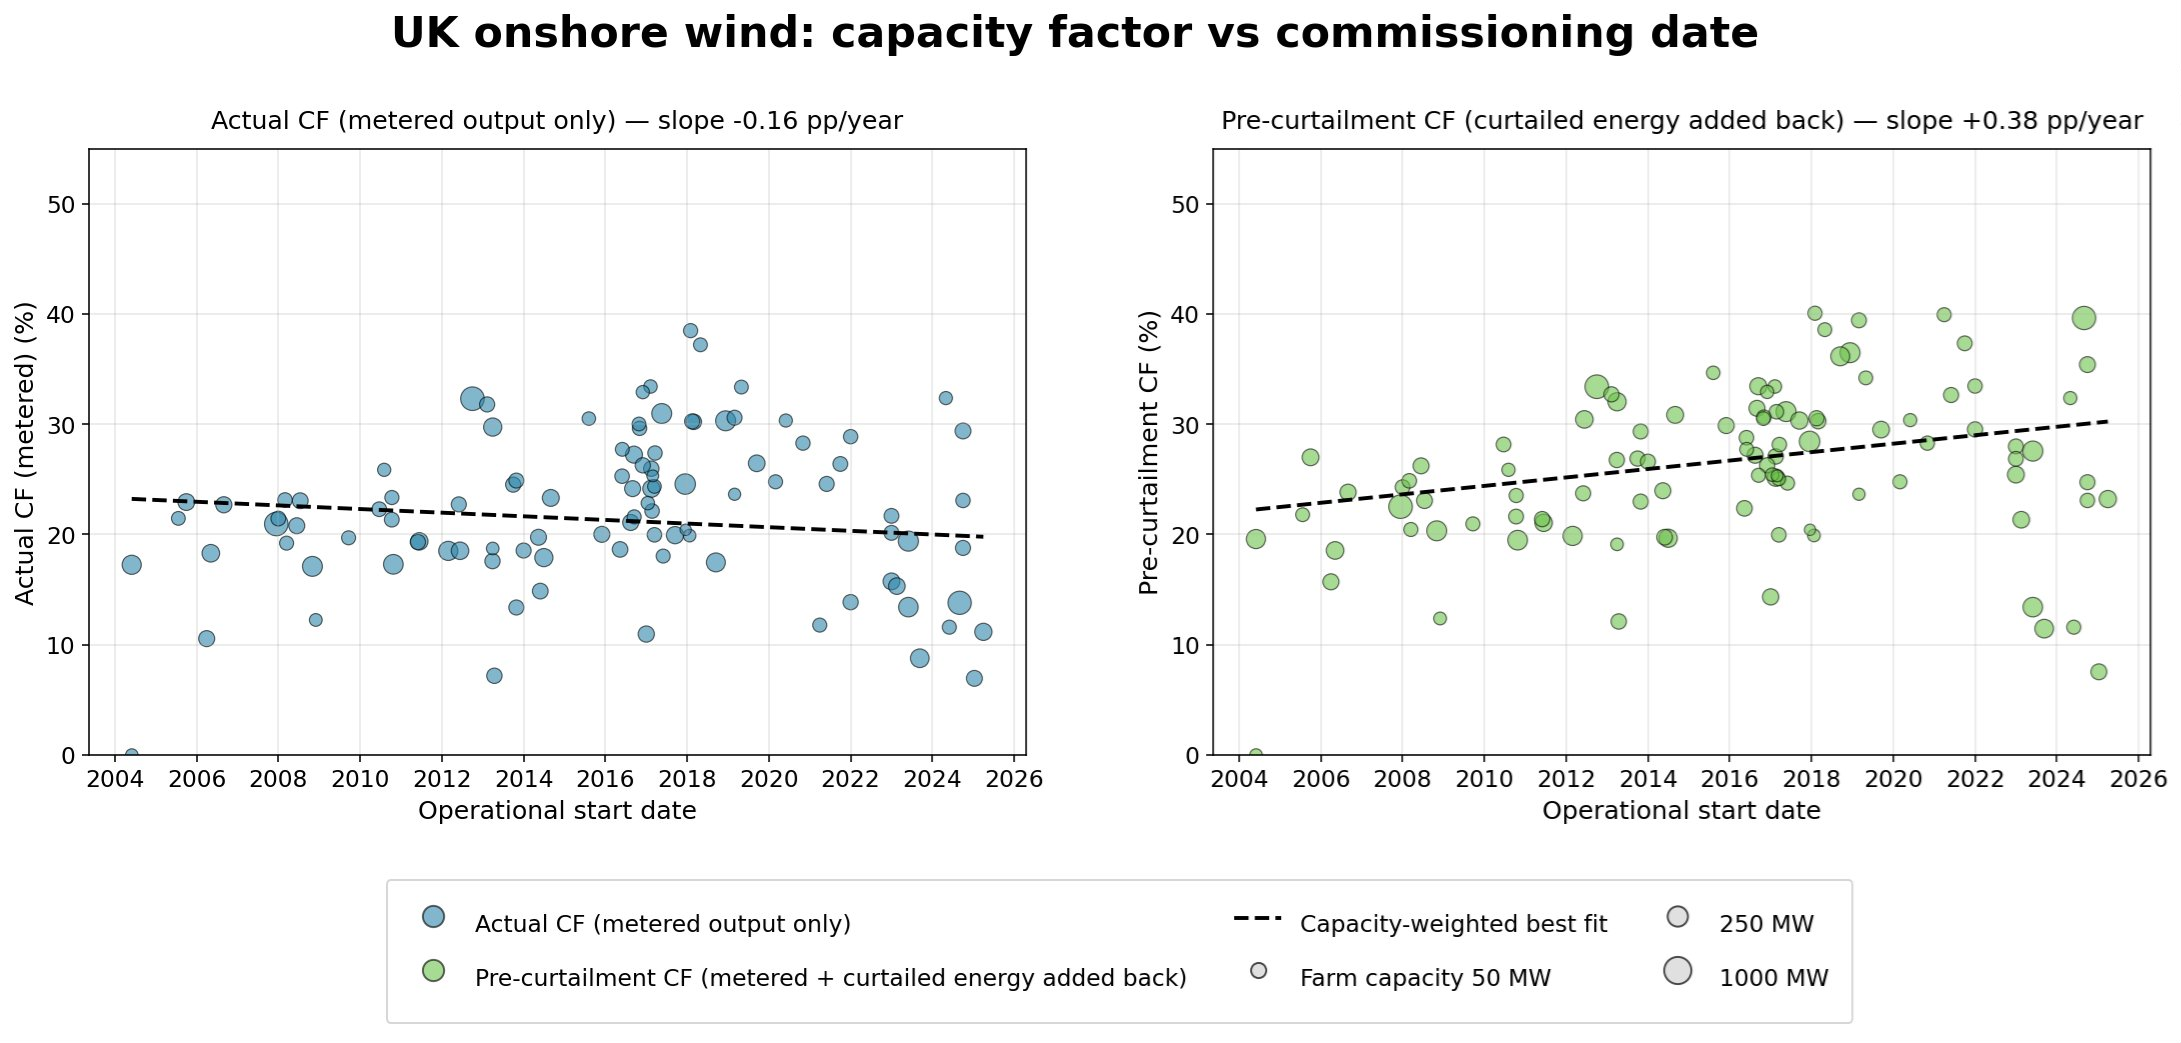
The left chart shows the headline picture. Capacity factors based on metered output have slipped slightly, from 23% in 2004 to 20% in 2025.
The right chart tells the real story. Add back the energy curtailed through the Balancing Mechanism, using BOA bid volumes, and the trend reverses. It rises from 22% in 2004 to 30% in 2025.
So newer farms are genuinely more productive per MW. Higher curtailment is just outweighing the gain in the headline number.
What is driving this
It is not simply bigger turbines. A larger MW rating alone would not lift capacity factor. The real drivers are:
- Bigger rotors per MW, meaning lower specific power.
- Taller hubs reaching higher wind speeds.
- Marginal sites no longer being built, so newer sites target stronger wind resource.
- Post-ROC, pre-AR4 farms bidding cheapest in curtailment and being bid off first.
- A Scotland-heavy build-out with stronger winds but tighter grid constraints.
Caveats. Transmission-metered farms only, so embedded onshore farms are excluded. Balancing Mechanism volumes miss pre-gate-closure self-dispatch, so the true gap is likely larger.
Charts and analysis by PowerVeritas. Where open datasets are used, sources are credited on the attributions page.