Not all grid curtailment is uncontrollable
A solar inverter looked like it was suffering normal grid curtailment. The real cause was high grid voltage at the connection point, and it was fixable.
This image shows a solar inverter curtailment issue identified during a performance assessment, which was having a significant impact on production through repeated trips and power throttling.
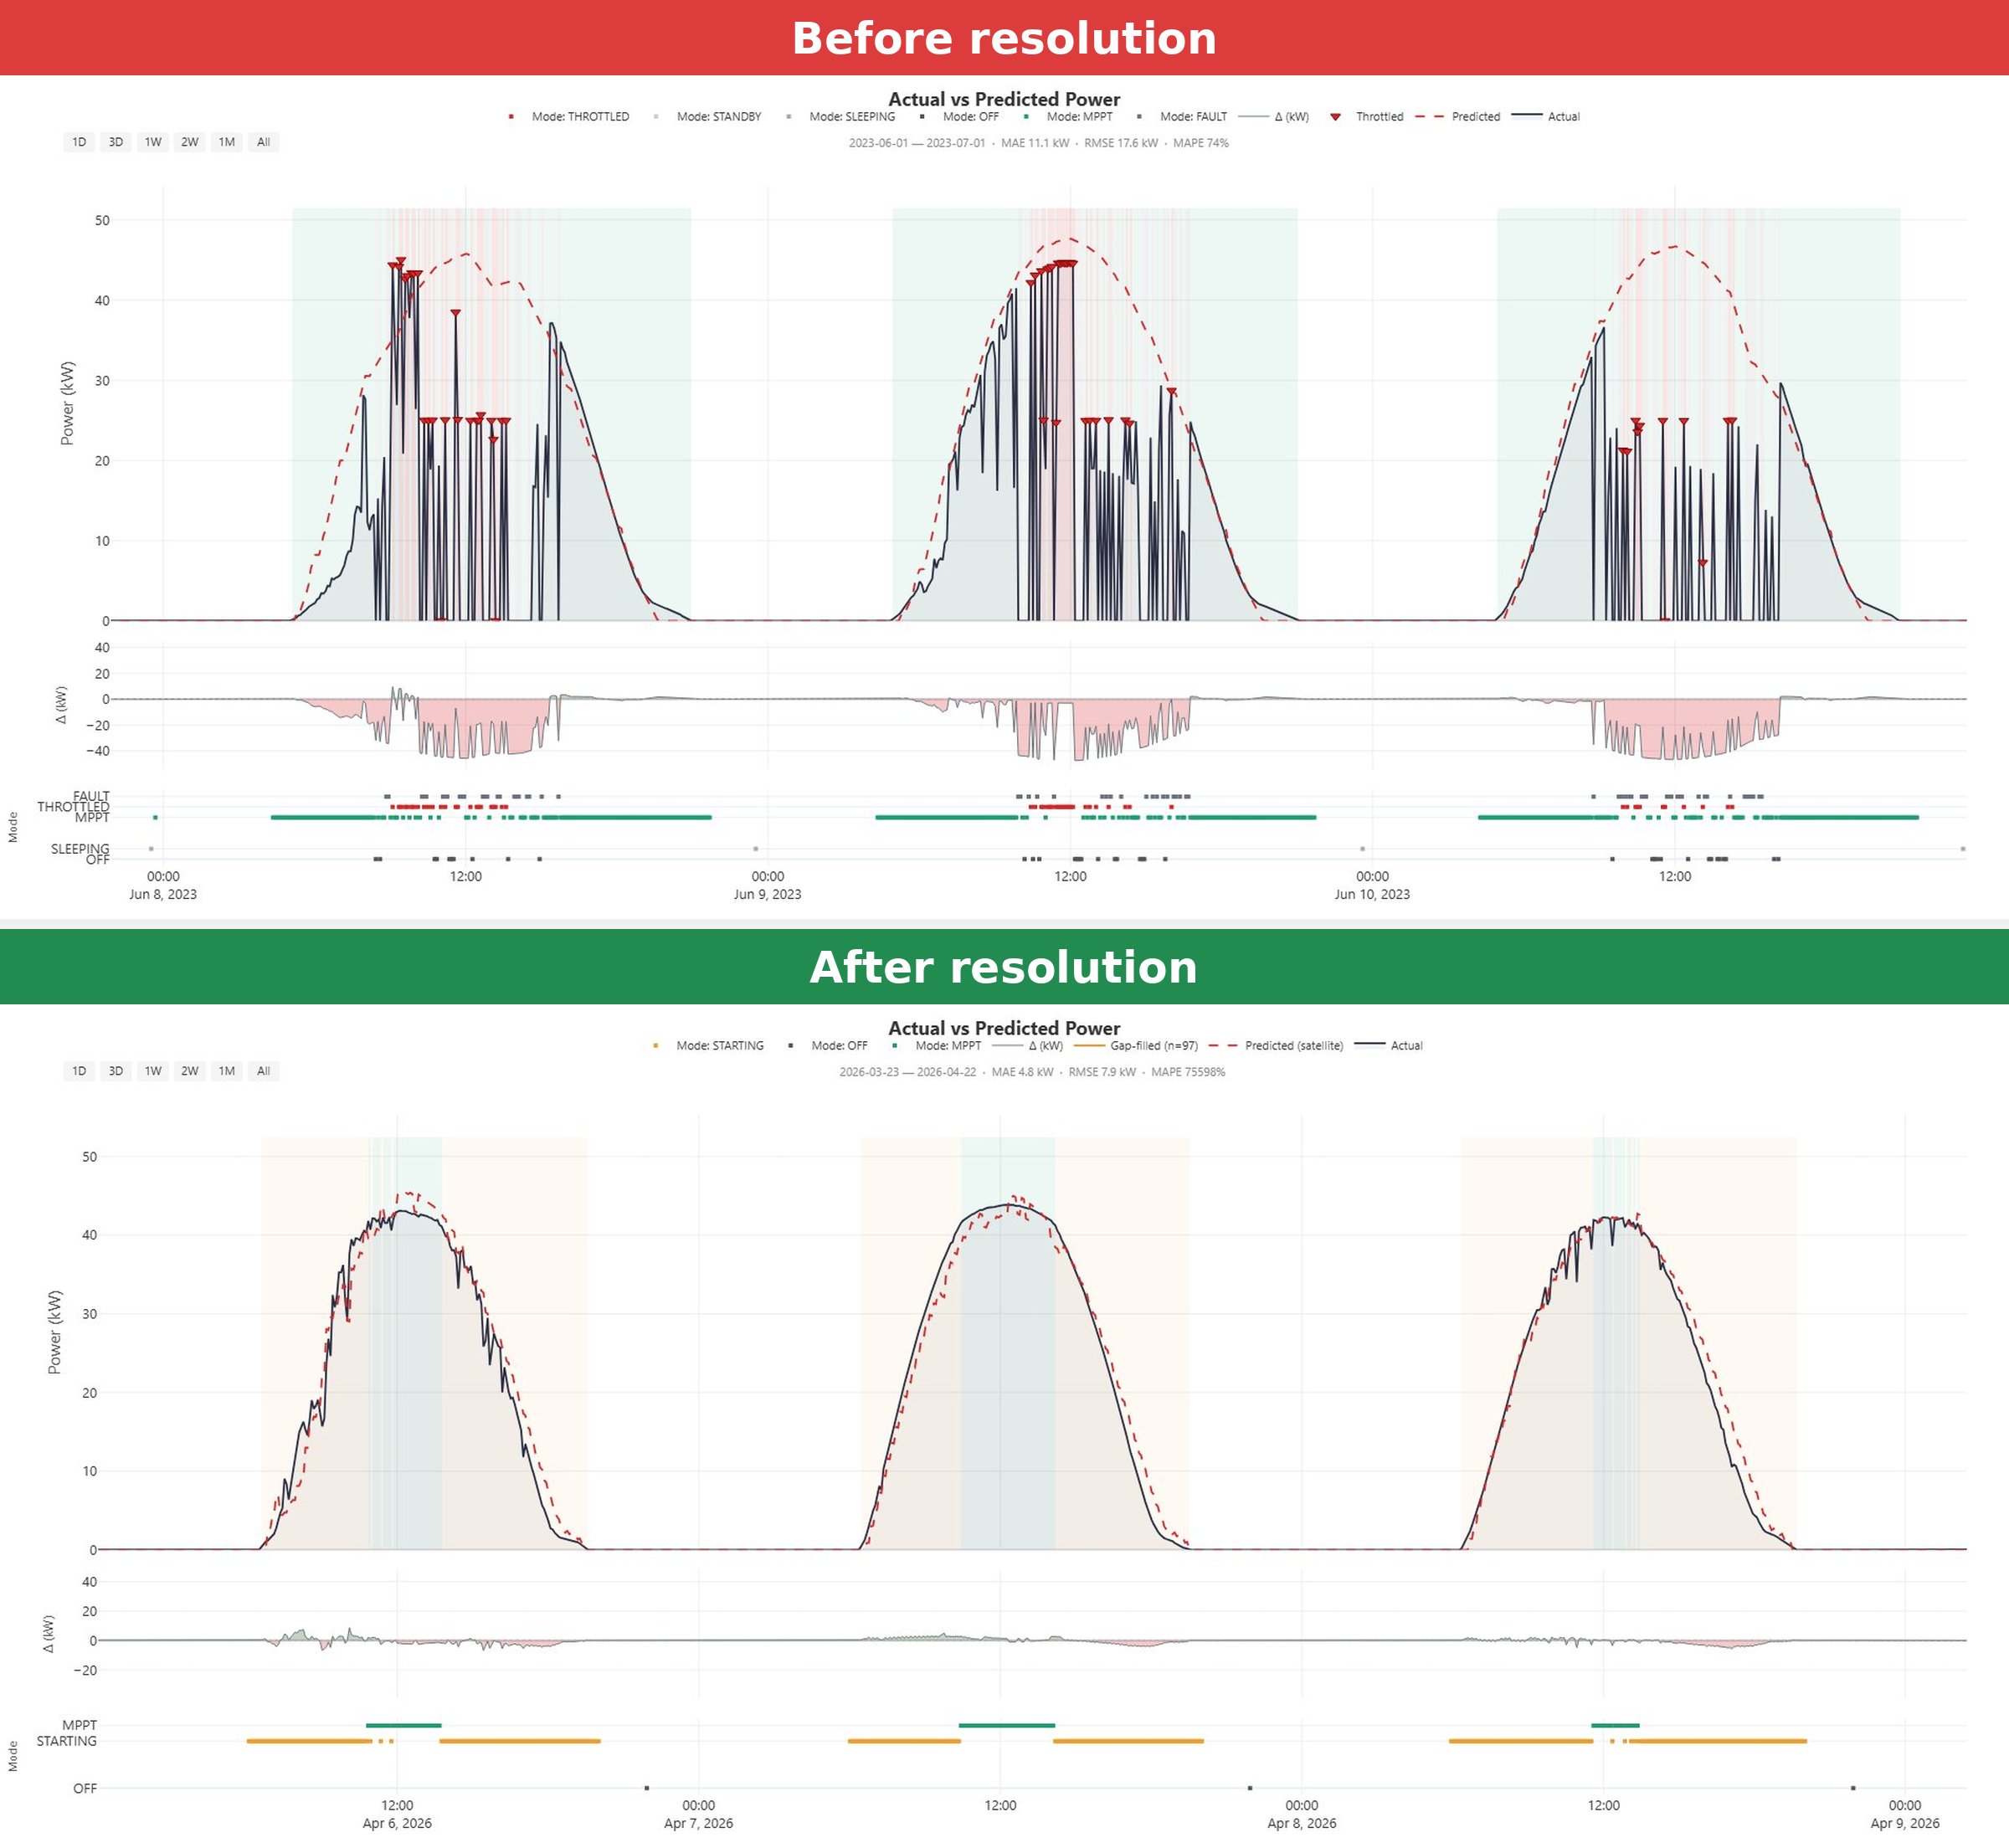
Investigation revealed the cause was due to a high grid voltage especially on one phase. A check of the voltage at the connection point confirmed it was above the 10% allowable band. The network operator was notified, confirmed the issue through their own monitoring and replaced the grid transformer, bringing voltage back into range and resolving the curtailment.
The root cause, in the voltage
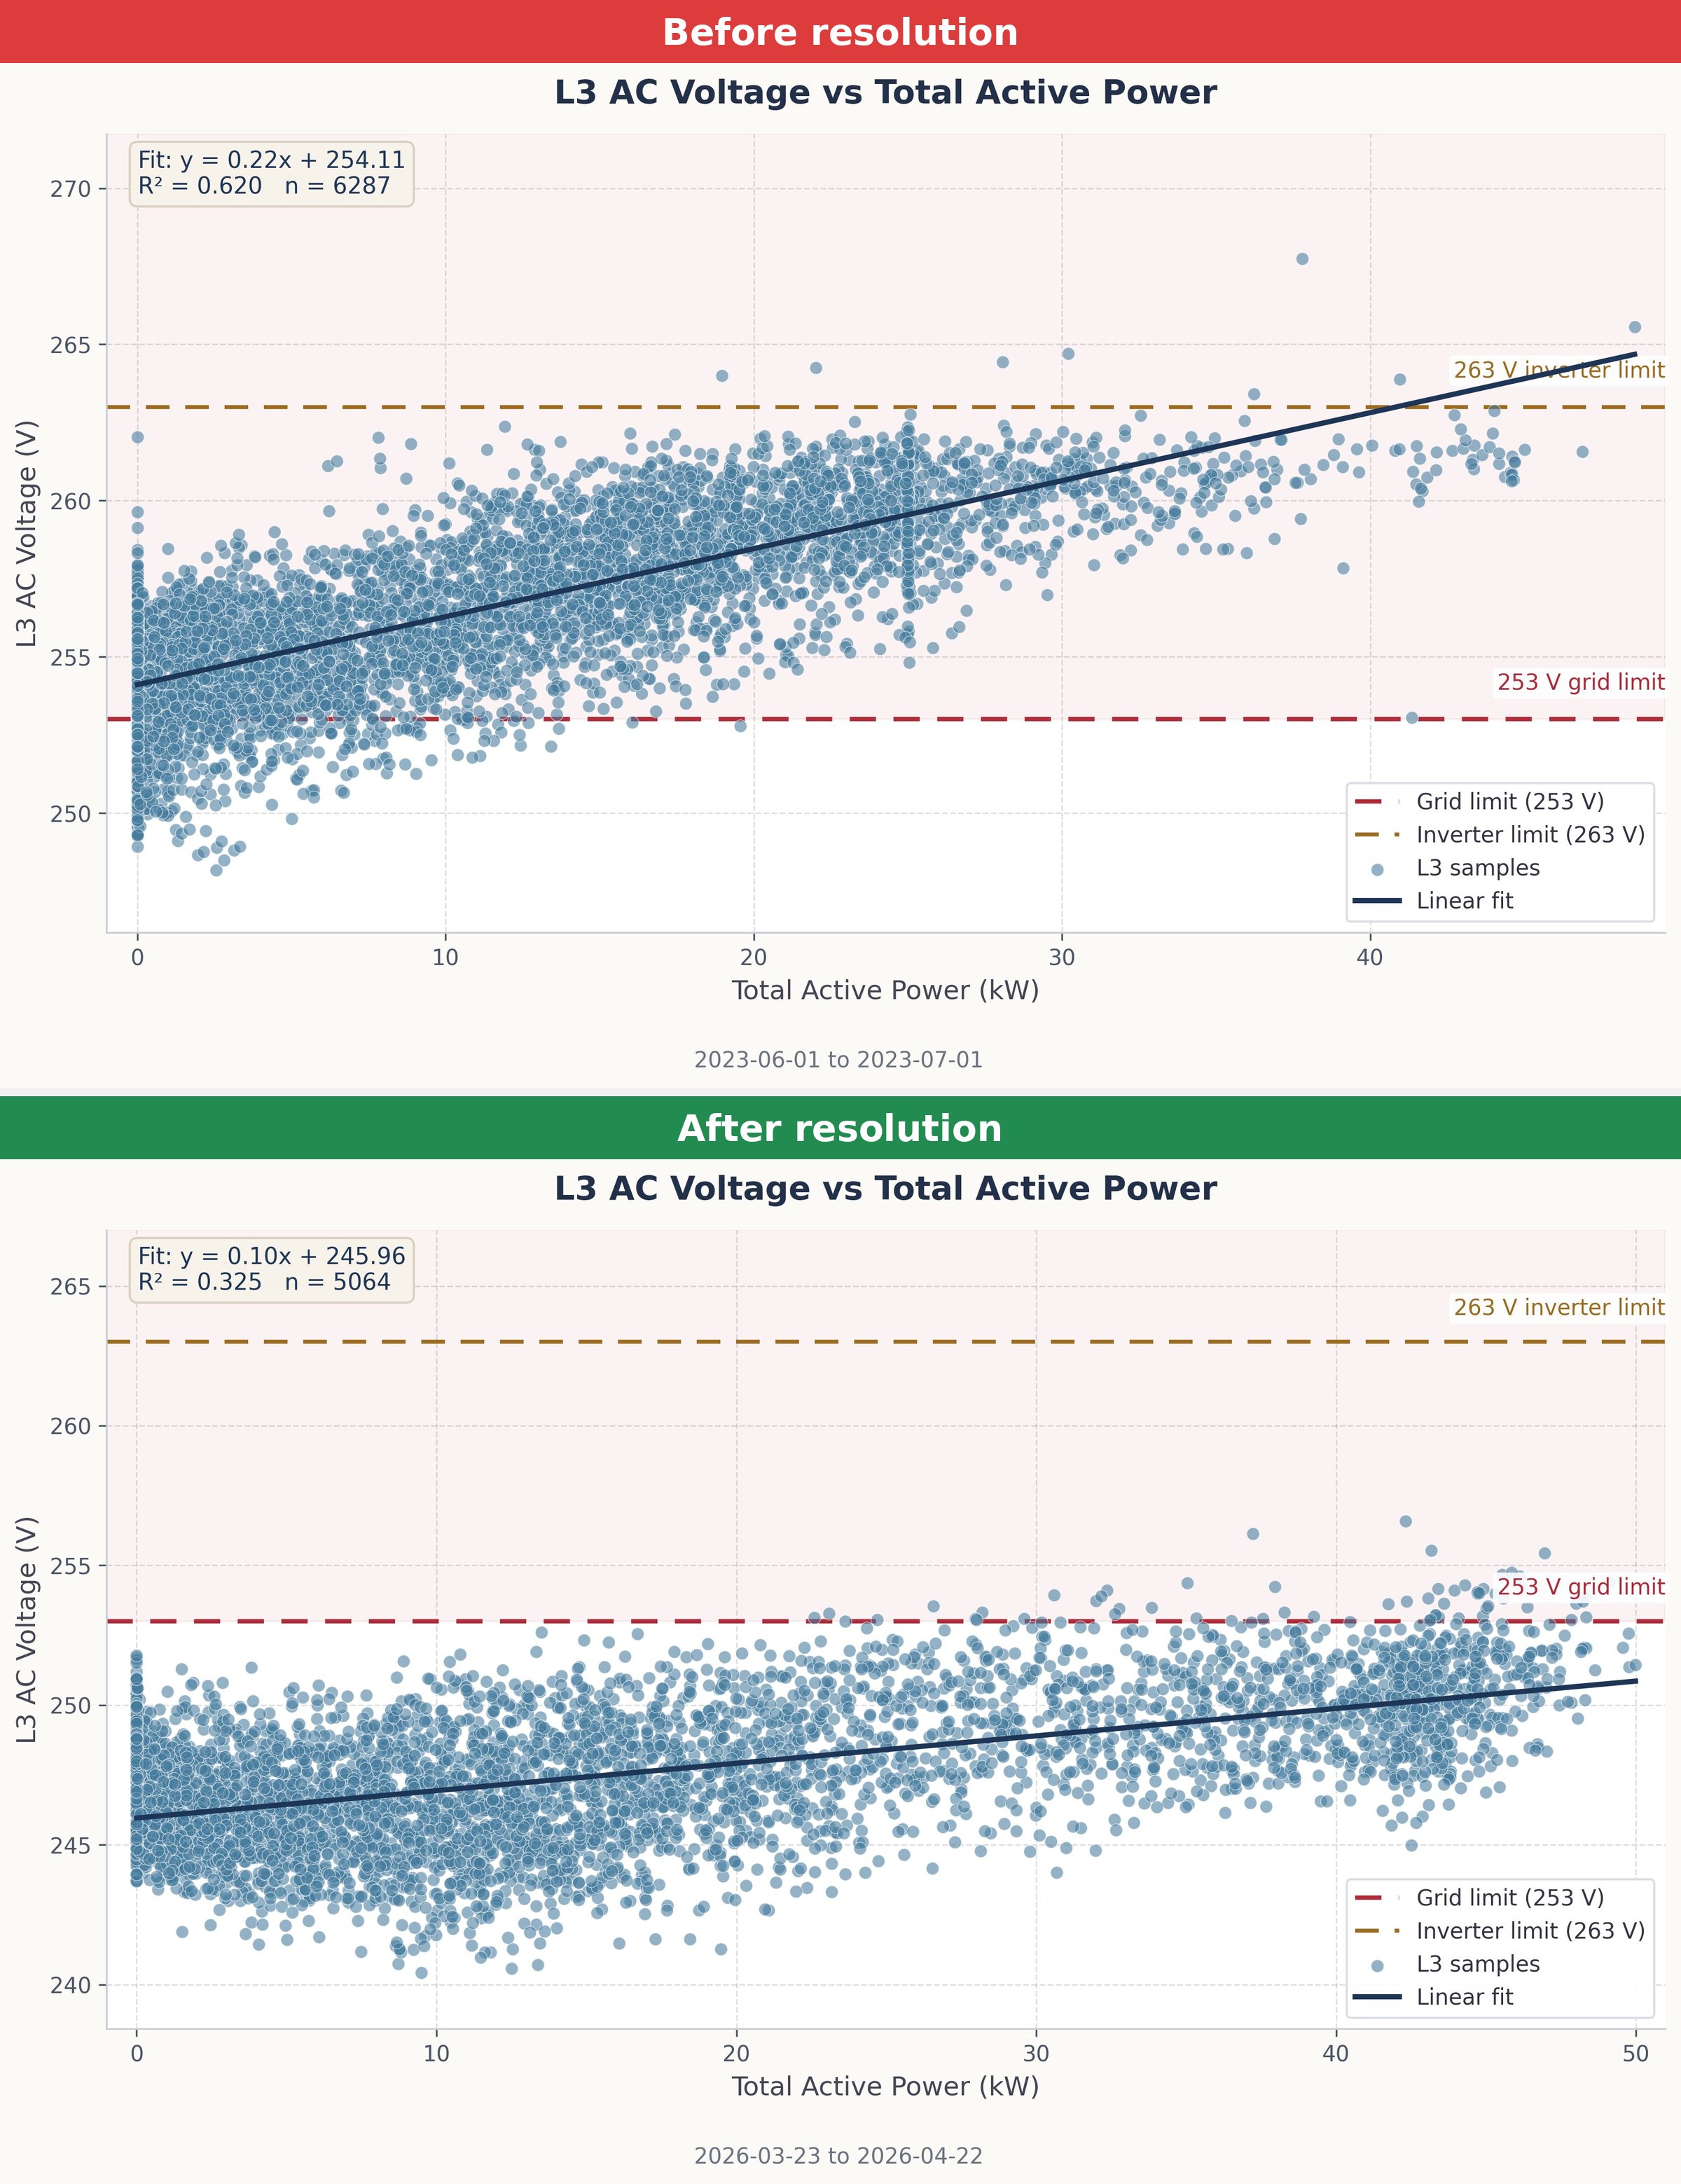
For those interested in the root cause, these voltage scatter plots show the before and after picture clearly.
Before the transformer replacement, L3 AC voltage was regularly breaching the 253 V grid limit and increasing with production to reach the 263 V inverter voltage limit, where it would initially throttle the production and then often trip the inverter.
After the grid transformer replacement, the no load voltage dropped by about 8 V, keeping the inverter comfortably within the inverter limits across the full output range.
This highlights the importance of performance assessments and fully investigating the cause of any unexpected underperformance and derating.
Charts and analysis by PowerVeritas. Where open datasets are used, sources are credited on the attributions page.